
 Support
 Brent falls sharply as prospects for US–Iran conflict resolution improve
Brent crude fell 11.27% to $85.87 per barrel as potential US–Iran ceasefire talks improved diplomatic sentiment across global energy markets.
Brent crude plunged 11.27% to $85.87 per barrel amid rising hopes of a diplomatic resolution between the US and Iran in the Middle East.
Houthi blockades in the Bab-el-Mandeb Strait threaten global oil supplies despite potential diplomatic talks.
Despite a sharp single-day drop, Brent retains a net price appreciation of roughly 20% in July.
Date: 27 July 2026
Brent crude under pressure as markets price in a potential US–Iran agreement
The Brent futures contract (BRNV6) fell by 11.27% to $85.87 per barrel amid rising hopes that the United States and Iran could reach an agreement to de-escalate ongoing tensions in the Middle East.
According to reports from Reuters, US President Donald Trump stated that Washington was engaged in "good talks" with Tehran and that a deal to resolve the conflict was possible. Nevertheless, Trump warned that US military strikes could resume should negotiations fail. These statements follow an operational ceasefire between the two nations over the weekend. Concurrently, Iranian Foreign Ministry spokesman Esmail Baghaei stated that bilateral messages were still being transmitted through mediators and confirmed that Tehran remains open to diplomacy.
However, although the current market movement represents a significant drop, the Brent contract still maintains a cumulative appreciation of around 20% in July alone. Market participants will remain focused on the trajectory of US–Iran negotiations in the coming days, as well as the conflict between Saudi Arabia and the Houthi group, which has escalated recently.
The Houthis have announced a maritime blockade in the Bab-el-Mandeb Strait off Yemen—a vital transit corridor through which approximately 7% of the global crude supply chain passes. This blockade would primarily affect Saudi Arabia, as this maritime passage serves as a critical route for its crude oil exports. Should both the Strait of Hormuz and the Bab-el-Mandeb Strait remain closed, the global supply chain for oil and other key commodities could be severely disrupted.
Nevertheless, in this context, neither the US nor Iran stands to benefit should the conflict prolong, as both economies face adverse economic impacts. Consequently, market participants appear cautiously optimistic regarding a short-term resolution, though high volatility remains the predominant driver in the crude oil markets.
Technical analysis of the Brent futures contract
From a technical perspective, the Brent crude futures contract is navigating a highly volatile period of consolidation. A detailed breakdown of the current market architecture reveals several key observations:
- Trend Context: In the short term, the Brent contract has entered a highly volatile regime in recent months. From a structural standpoint, however, the contract continues to trade above its 200-day Simple Moving Average (SMA), suggesting that a primary bullish bias remains predominant.
- Resistance Levels: If the short-term support at $86.50 holds and prices rebound to the upside, the next prominent resistance is the $100 psychological barrier. Above this level, the $110 threshold represents a major technical ceiling.
- Support Levels: In the event that immediate short-term support at $86.50 fails to hold, the next significant technical floors are located at $80 and $70 per barrel. A decisive break below these levels would materially increase the probability of a broader market correction.
- Momentum Indicators: The Moving Average Convergence Divergence (MACD) continues to exhibit an upward impulse, although the histogram is losing momentum. Conversely, the Relative Strength Index (RSI) is signalling a rejection from overbought territory, moving towards a lower range. Nevertheless, fundamental and geopolitical developments are widely expected to remain the primary drivers shaping future price action.
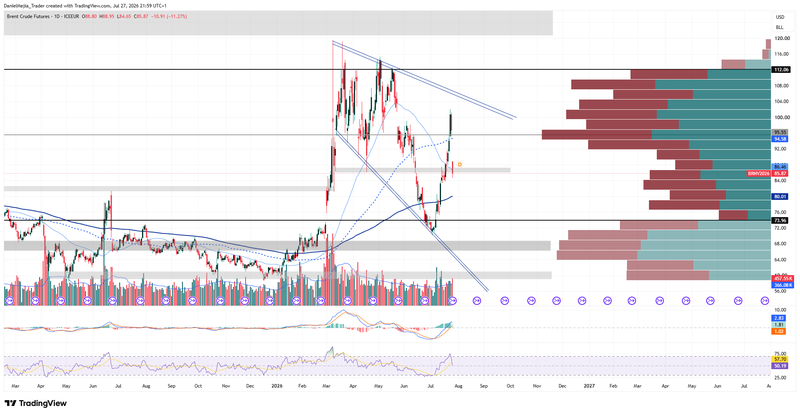
Figure 1. Brent Futures Contract (2025–2026). Source: Data from the ICE-EUR Exchange; own analysis conducted via TradingView.


