Brent hits six-month high on US-Iran tensions, falling inventories
The Brent crude futures contract has reached its highest level in six months, propelled by escalating geopolitical tensions between the United States and Iran. Market prices were further supported by a significant and unexpected contraction in US crude oil inventories, signalling a tightening global supply-demand balance.

Brent futures settled at $71.66 per barrel as US President Donald Trump issued a stern warning to Tehran, indicating severe military consequences if a new nuclear agreement is not reached.
Data from the US Energy Information Administration (EIA) revealed a substantial decline in both crude and gasoline stockpiles, suggesting robust underlying demand that exceeded market expectations.
Brent crude successfully breached the $70.00 per barrel psychological barrier, marking a significant technical breakout amidst a period of heightened regional volatility.
Oil prices rally on escalating US-Iran tensions and surprise crude stockpile draw
Brent crude futures (BRNJ26) climbed 1.86% to settle at $71.66 per barrel, approximately the highest level recorded in the last six months. The global benchmark rose sharply in response to deteriorating diplomatic relations between Washington and Tehran. According to Reuters, President Donald Trump cautioned that "Iran must reach a deal or bad things will happen". These remarks were delivered against the backdrop of an intensive US military build-up in the Middle East, including the deployment of warships near Iranian territorial waters.
Market participants are increasingly pricing in the risk of supply disruptions. Traders are particularly concerned with the potential closure of the Strait of Hormuz—a strategic maritime chokepoint through which approximately 20% of the world’s oil supply transits. While diplomatic efforts continue in Geneva, any escalation into direct confrontation is expected to cause severe volatility in energy logistics.
Adding to the upward momentum, the US Energy Information Administration (EIA) reported that domestic crude oil inventories fell by 9.014 million barrels for the week. This figure was considerably lower than the 2.1 million-barrel build anticipated by analysts. Furthermore, gasoline stocks decreased by 3.213 million barrels, far exceeding the forecast 0.3 million-barrel contraction. The convergence of these two reports suggests an organic strengthening of oil demand, providing a secondary fundamental pillar for the current price rally.
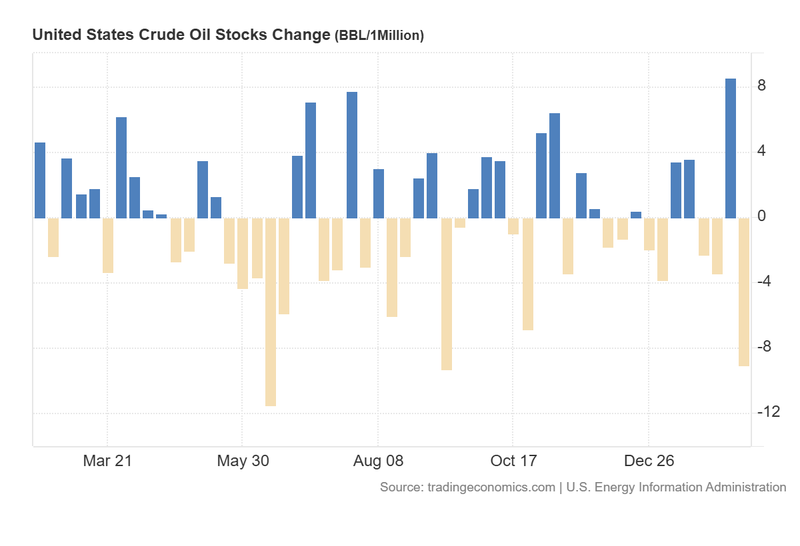
Figure 1. US Crude Oil Stocks Change (2025–2026). Source: Data from the US Energy Information Administration; Figure obtained from Trading Economics.
Technical analysis of the Brent futures contract (BRNH26)
From a technical perspective, the Brent futures contract remains broadly confined within a medium-term bearish channel, though it is nearing the upper ceiling of this structure. Key observations include:
- Trend Context: Despite the long-term descending channel, Brent is trading above its 50, 100, and 200-day Simple Moving Averages (SMAs). Momentum indicators reflect a surge in demand-side strength, largely fuelled by the geopolitical risk premium.
- Resistance Levels: If the immediate resistance at $72.00 per barrel is breached, the next significant technical ceiling is located at $76.50, which represents the upper boundary of the medium-term bearish channel. A sustained break above $76.50 would signal a trend reversal and potential extension into higher price territories.
- Support Levels: Should a correction occur, the immediate support is identified at $68.00 per barrel. If this level is invalidated, the next structural floor sits at the $60.00 psychological level. A breach of the $60.00 zone would significantly increase the probability of a deeper market correction.
- Momentum Indicators: The Moving Average Convergence Divergence (MACD) is rising following a bullish divergence, signalling strengthened upward momentum. Concurrently, the Relative Strength Index (RSI) is trending higher and approaching the overbought threshold, suggesting the rally may soon face consolidation.
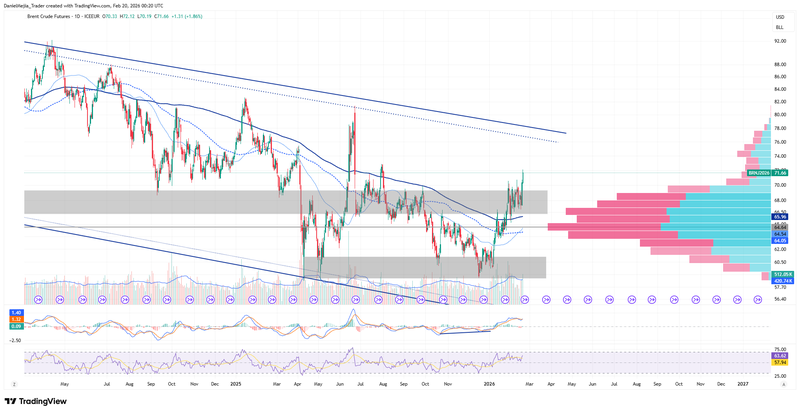
Figure 2. Brent futures contract BRNH26 (2024–2026). Source: Data from the ICE-EUR Exchange; own analysis conducted via TradingView.


