Canadian PPI hits multi-year high, signalling inflation pressures; USD/CAD advances
The USD/CAD currency pair advanced to 1.4128 as a soaring Canadian Producer Price Index (PPI) reached 13.6% year-on-year, driven primarily by energy supply disruptions in the Middle East.

Canada’s annual PPI jumped to 13.6%, its highest since June 2022, driven by chemical and energy spikes stemming from Middle East supply disruptions.
The USD/CAD rose 0.25% to 1.4128, lifted by a strong DXY and expectations that the Fed will maintain to a more restrictive monetary policy stance.
The currency pair continues to trade above its 50, 100, and 200-period Simple Moving Averages (SMAs). However, heavily overbought readings on both the MACD and RSI indicators suggest caution despite the predominant bullish momentum.
Canada’s PPI reaches multi-year peak, highlighting producer price pressures; USD/CAD moves higher
The Canadian dollar has faced depreciation pressure against the US dollar, largely reflecting mounting expectations that the Federal Reserve may maintain or even intensify its restrictive monetary stance in response to persistent inflationary pressures. Moreover, Canada’s latest Producer Price Index (PPI) reading showed a marked increase. This spike may eventually feed through into consumer prices, as firms are generally unable to absorb higher input costs on a sustained basis.
According to data released by Statistics Canada, the annual PPI accelerated sharply, rising from 11.1% in April to 13.6% in May (year-on-year change), marking its highest level since June 2022. However, on a monthly basis, the PPI increased by 1.2%, falling short of analysts’ expectations of a 1.8% expansion and printing below the previous month's reading of 1.6%.
A Trading Economics report indicates that the strongest price increases were concentrated in raw materials, particularly chemical products (+7.0%), energy and petroleum products (+2.5%), and primary non-ferrous metal products (+1.1%). These gains are largely attributable to disruptions in the Middle Eastern energy supply chain, which have exerted upward pressure on commodity prices across multiple sectors.
Following the economic data the USD/CAD currency pair advanced 0.25% to 1.4128, supported by a strengthening US Dollar Index (DXY) compounded by short-term weakness in the Canadian dollar.
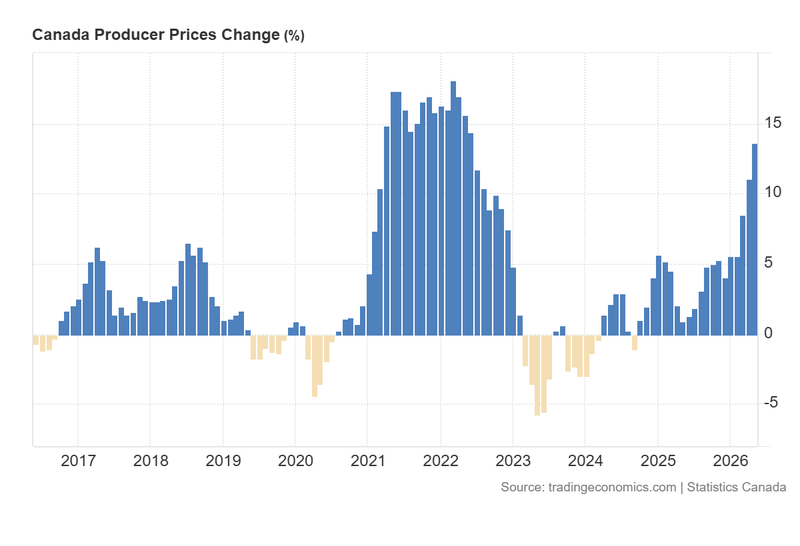
Figure 1. Canada Producer Price Index (2016-2025). Source: Data from Statistics Canada; chart obtained from Trading Economics.
Technical analysis of the USD/CAD pair
From a technical perspective, the USD/CAD pair has exhibited robust short-term bullish momentum over the last weeks. Key observations include:
- Trend Context: In the long term, the USD/CAD pair has been oscillating within a broad consolidation pattern. Over recent weeks, however, the pair has developed a prominent upward trend. Additionally, the price is trading comfortably above its long-term simple moving averages (50, 100, and 200 periods), reinforcing the underlying bullish bias.
- Resistance Levels: Should the immediate short-term resistance at 1.4130 be breached to the upside, the next significant ceiling corresponds to the 1.4500 level. This level is included in the current analysis as it reflects the technical projection derived from a historical double-bottom pattern that was validated during previous market sessions. A decisive break above this zone would signal potential for an extended rally into higher price territories.
- Support Levels: If the short-term resistance is respected and prices turn lower, a relevant structural floor is located at 1.3930, which serves as a key pivot point. A breach of the 1.3930 zone would increase the probability of a deeper market correction down toward 1.3820, where the 200-period SMA converges.
- Momentum Indicators: While the bullish momentum has shown considerable strength, both the Moving Average Convergence Divergence (MACD) and the Relative Strength Index (RSI) indicators are trading deep within overbought territory. This extreme positioning counsels caution regarding the immediate sustainability of the current upward move.
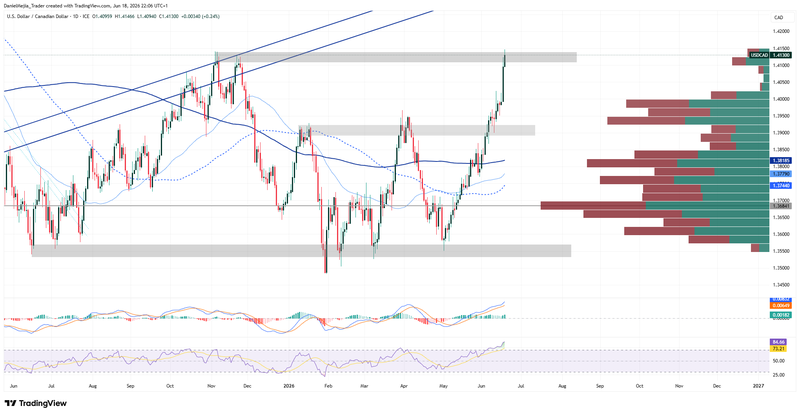
Figure 2. USD/CAD pair (2024-2026). Source: Data from the Intercontinental Exchange (ICE); Own analysis conducted via TradingView.


