
 Support
 Dollar index advances as US 30-year Treasury yields reach multi-year highs
Rising US 30-year Treasury yields and sticky inflation expectations are driving capital into the greenback, pushing the US Dollar Index higher.

US 30-year Treasury yields hit 5.57%, reaching multi-year highs last recorded in 2002.
Geopolitical tensions in the Strait of Hormuz and surging demand for artificial intelligence continue to fuel global inflation risks.
Investors are flocking to the US dollar to capture higher yields and secure safe-haven geopolitical hedging.
Date: 30 September 2026
US 30-year Treasury yields reach levels unseen since 2002
Yields on 30-year US Treasury bonds reached the 5.57% mark—a level last recorded in 2002. This selling pressure across the bond market stems from growing expectations that the Federal Reserve may adopt a more restrictive monetary policy stance at upcoming meetings. Market expectations have been bolstered by elevated energy prices amidst ongoing US-Iran tensions in the Middle East, which threaten to keep global oil supply constrained as energy flows through the strategic Strait of Hormuz remain subdued.
In response to persistent inflationary pressures globally, major central banks have raised their benchmark interest rates. Notably, the Federal Reserve (Fed), the European Central Bank (ECB), the Bank of Japan (BoJ), and the Reserve Bank of Australia (RBA) have all adopted tighter monetary policy postures to curb price growth. Furthermore, the Bank of England (BoE) is expected to adopt this trajectory at its upcoming monetary policy meetings.
Against this backdrop, market participants anticipate that the Federal Reserve could implement further tightening, given that inflation pressures are currently being driven by three concurrent factors: elevated energy costs, tariff-driven import prices, and expanding demand for artificial intelligence (AI) infrastructure and products. Consequently, the US central bank is weighing compound price pressures should these underlying drivers continue to exert influence in tandem.
Additionally, the Federal Reserve has remained emphatic that its primary objective is inflation containment, as headline figures remain well above its 2.0% target, amid an environment where employment and broader economic growth demonstrate continued strength and resilience.
In this context, investors are focusing closely on two critical economic indicators scheduled for release this week: the Personal Consumption Expenditures (PCE) Price Index—the Federal Reserve’s preferred inflation metric—and the Bureau of Labor Statistics (BLS) employment report. Should inflation remain elevated while the labour market signals ongoing resilience, the US central bank may reinforce its hawkish stance.
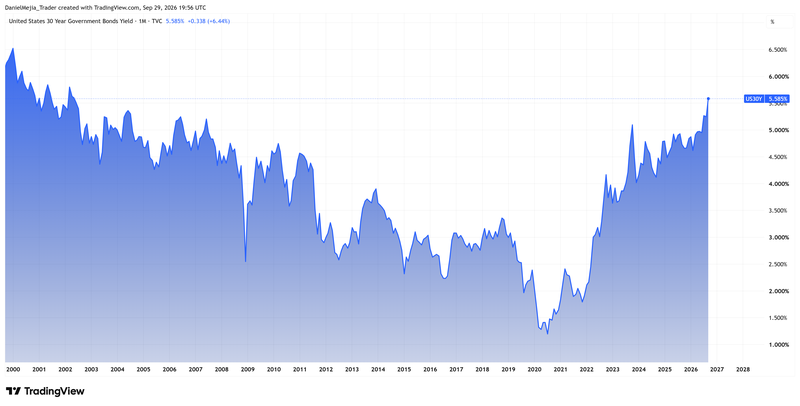
Figure 1. US Government Bonds 30YR Yield (2000–2026). Source: Chart obtained via TradingView.
Why is the US dollar index advancing?
The US Dollar Index (DXY) is experiencing sustained appreciation amidst rising expectations of a more hawkish Federal Reserve. This trend is primarily attributable to market participants seeking dollar liquidity in order to allocate capital into US Treasury securities. In an environment characterized by elevated interest rates, sovereign debt instruments become increasingly attractive as their risk-adjusted return profiles improve.
Simultaneously, global investors are seeking portfolio hedges against a complex macroeconomic and geopolitical environment. This safe-haven demand further bolsters the greenback as expectations build for continued upward momentum.
Together, it is possible that these dual dynamics are generating heightened demand for the US currency, providing structural support for its ongoing market appreciation.
Technical perspective on the US dollar index (DXY)
From a technical standpoint, the US Dollar Index reflects medium-term consolidation while displaying robust short-term bullish momentum. Key technical observations include:
- Trend Context: Over the medium term, the index remains within a range-bound structure. Nevertheless, price action continues to trade comfortably above its 50-day, 100-day, and 200-day Simple Moving Averages (SMAs), indicating that a bullish bias remains predominant in the near term. Notably, the DXY is testing a significant structural resistance level, where a decisive breakout could catalyse further appreciation, whereas a rejection may signal renewed downside pressure.
- Resistance Levels: To the upside, the 101.50 mark represents a major technical hurdle. A decisive breakout above this barrier would shift focus towards the 104.00 handle. A sustained move beyond these levels would signal a potential transition into a higher trading range.
- Support Levels: On the downside, should a market retracement occur, primary structural support is located at the 100.00 threshold. A breakdown beneath this support floor would bring the next key level of interest at 98.70 into focus. A sustained break below these levels would likely trigger a deeper bearish correction.
- Momentum Indicators: Both the Moving Average Convergence Divergence (MACD) and the Relative Strength Index (RSI) are sloping upwards, suggesting that short-term bullish momentum could persist. Nonetheless, macroeconomic and geopolitical developments remain the primary drivers of broader directional bias.
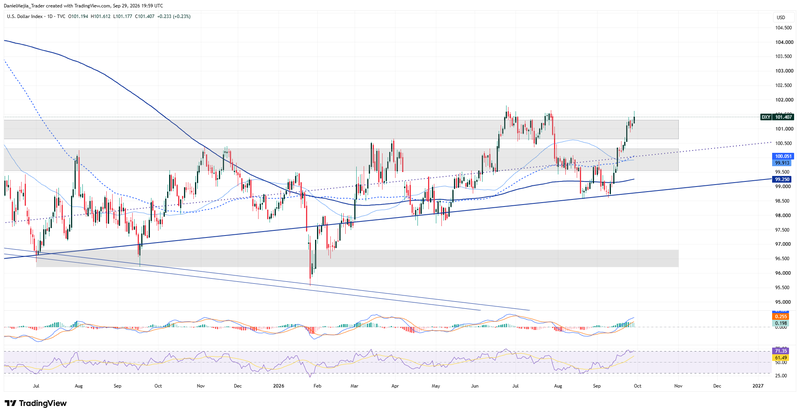
Figure 2. Dollar Index (2025–2026). Source: Intercontinental Exchange (ICE) data; author's analysis via TradingView.


