
 Support
 Euro Area producer prices register first decline in four months; Euro advances
Eurozone producer prices eased to 4.6% in June as energy costs declined, lifting the euro. However, recent oil price spikes leave future European Central Bank (ECB) rate moves and technical trends uncertain.

Euro Area PPI cooled from 5.9% in May to 4.6% in June, driven by lower energy costs.
The euro rose 0.20% to $1.1553, though oil price rebounds obscure the July inflation outlook.
EUR/USD trades in consolidation below its 100-day and 200-day SMAs, reflecting market hesitation.
Cooling Euro Area producer prices support economic expectations and lift the euro
According to data released by Eurostat, the Euro Area Producer Price Index (PPI) eased from 5.9% in May to 4.6% in June, aligning with analysts' expectations. This deceleration is particularly significant given that the PPI indicator had reached its highest level since March 2023 in May, raising concerns over lingering inflationary pressures should producers prove unable to absorb rising input costs. On a monthly basis, producer prices fell by 0.3%, influenced by the US–Iran ceasefire agreement in June. Over this period, energy costs declined by 1.5%.
Nevertheless, while the moderation in PPI relieves immediate pressure on the ECB regarding potential interest rate increases to contend with inflation, market participants remain focused on upcoming July inflation assessments. In July, oil prices subsequently rebounded by approximately 20% following disruptions to the US–Iran ceasefire. Consequently, investors may view the current PPI reading more as an improvement in underlying economic conditions rather than a definitive signal of future ECB policy shifts.
Following the release of the economic data, the euro appreciated by 0.20% against the US dollar to trade at $1.1553. The EUR/USD pair nevertheless remains confined to a broader consolidation range observed in recent months, underscoring ongoing market uncertainty regarding a prevailing trend.
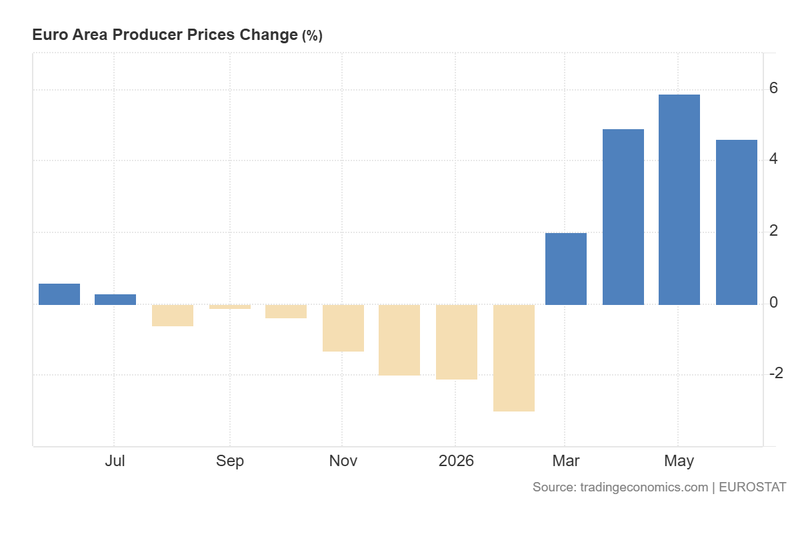
Figure 1. Euro Area Producer Price Index (2025–2026). Source: Data from Eurostat; figure obtained from Trading Economics.
Technical analysis of the EUR/USD pair
From a technical standpoint, the EUR/USD pair continues to signal market indecision as it oscillates within a defined consolidation range. Key observations include:
- Trend Context: Over the longer term, the pair remains bound within a sideways consolidation pattern, trading below its 100-day and 200-day Simple Moving Averages (SMAs) and reflecting widespread market caution.
- Resistance Levels: Should the 200-day SMA at $1.1628 be breached to the upside, the next major technical ceiling is identified at $1.1845—a prominent structural resistance level. A decisive breakout above this zone would signal the potential for further upside toward higher valuations.
- Support Levels: In the event of a market retracement, two key support levels stand out at $1.1366 and $1.1260. A breach of these levels would significantly increase the probability of a deeper market correction.
- Momentum Indicators: Both the Moving Average Convergence Divergence (MACD) and the Relative Strength Index (RSI) are exhibiting an upward trajectory, suggesting that short-term bullish momentum may persist. However, fundamental drivers are expected to remain the primary determinants of future market direction.
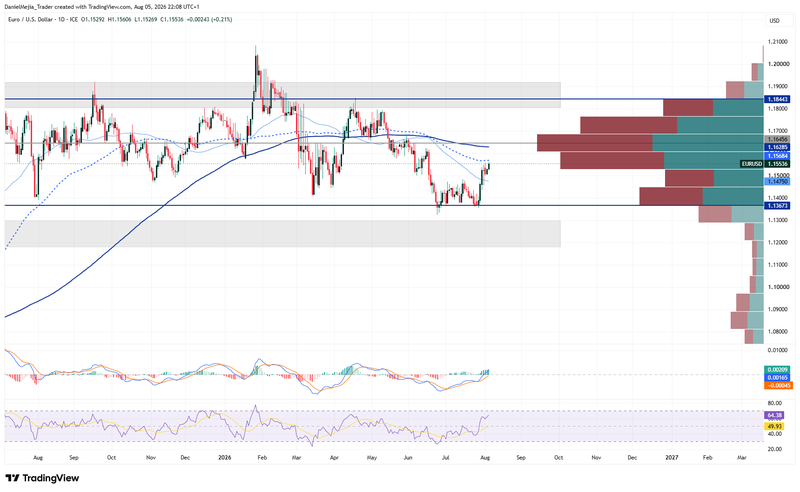
Figure 2. EUR/USD Pair (2025–2026). Source: Data from the Intercontinental Exchange (ICE); own analysis conducted via TradingView.


