Support
 Fed's Kevin Warsh keeps door open to further rate hikes; Nasdaq retreats
The Nasdaq fell by 0.70% as hawkish comments from Federal Reserve Chair Kevin Warsh elevated expectations of a rate hike in September, driving US Treasury yields and the US dollar higher.
Fed Chair Kevin Warsh signalled potential interest rate hikes to curb persistent US inflation.
The Nasdaq dropped by 0.70%, while 10-year Treasury yields rose by 5.4 basis points and the US dollar gained 0.55%.
The CME FedWatch tool showed September rate-hike probabilities surging to 59.7% following the address.
Investors continue to monitor the impact of the US–Iran conflict on oil prices alongside the upcoming September CPI release.
Date: 28 August 2026
Would the Fed hike rates further if inflation remains elevated?
The Nasdaq 100 index fell by 0.70% to 29,433 points following a hawkish speech by Federal Reserve Chair Kevin Warsh at the central bank's annual Jackson Hole Economic Symposium.
The Chair stated that further interest rate hikes could be required to ease price pressures, emphasising that the central bank must ensure underlying inflation converges towards its target, as price stability remains its primary mandate—as quoted by Reuters. Additionally, Warsh noted that the Fed’s predominant focus should remain on prices, given that the labour market is stable and the economy resilient, yet inflation has persisted above target for an extended period.
Notably, the Fed Chair was emphatic regarding the need for the central bank to exercise caution in its communications with market participants. He stressed that monetary policy tools are powerful drivers of investment decisions, even if the institution shares information primarily for explanatory purposes—a stance consistent with the FOMC’s decision to avoid explicit forward guidance.
Following the Fed Chair’s remarks, the CME FedWatch tool displayed a significant shift in market probabilities. The baseline scenario for the Fed’s September meeting now points to a potential interest rate hike, with an implied probability of 59.7%—up from 40.0% prior to Warsh’s speech. Conversely, the market-implied probability of rates remaining unchanged stands at 40.3%. Looking ahead to the December meeting, the highest single probability reflects a second rate hike, currently priced at 40.1%.
Concurrently, the University of Michigan published its final survey results for August. The report indicated a slight decline in one-year-ahead inflation expectations from 4.2% to 4.0% (monthly change), coming in lower than the forecasted 4.3%. Meanwhile, five-year inflation expectations remained steady at 3.3%. The report also highlighted growing consumer uncertainty surrounding the ongoing US–Iran conflict in the Middle East, with households anticipating further gasoline price increases over both the short and long term.
In this context, the US Dollar Index rose by 0.55% to 99.68 points, while the 10-year US Treasury yield advanced by 5.4 basis points to 4.73%. This market reaction reflects a clear repricing towards higher benchmark interest rates. Moving forward, market participants will focus heavily on the upcoming US inflation report scheduled for release on 11 September, immediately prior to the Fed’s policy meeting on 16 September. In addition, developments in the ongoing US–Iran conflict in the Middle East will remain a central driver of market sentiment.
Technical analysis of the Nasdaq index
From a technical perspective, the Nasdaq index maintains a structurally bullish long-term trajectory. However, a detailed assessment of the chart highlights key shifts in underlying momentum:
- Trend Context: Over a broader horizon, the Nasdaq exhibits a classic ascending structure defined by a sequence of higher highs and higher lows. The index continues to trade above its 50-day, 100-day, and 200-day Simple Moving Averages (SMAs), reinforcing its primary bullish trend. Nevertheless, the short-term structure reveals a three-month consolidation range, reflecting prevailing market uncertainty.
- Resistance Levels: Should the index regain its bullish impulse, primary structural resistance rests at 30,660 points—its record peak. A decisive breakout above this threshold would initiate a new phase of price discovery in uncharted territory, potentially the 33,000 level under a continuation pattern.
- Support Levels: In the event of a market retracement, prominent supports lie at 28,300 and 27,300 points, near where the 200-day SMA currently sits. A decisive breach below these levels would significantly increase the probability of a deeper market correction.
- Momentum Indicators: Both the Moving Average Convergence Divergence (MACD) and the Relative Strength Index (RSI) are trading at neutral levels, pointing to a lack of a clear directional bias in the short term. Consequently, macroeconomic and geopolitical drivers are expected to exert a primary influence on the technical structure of the market.
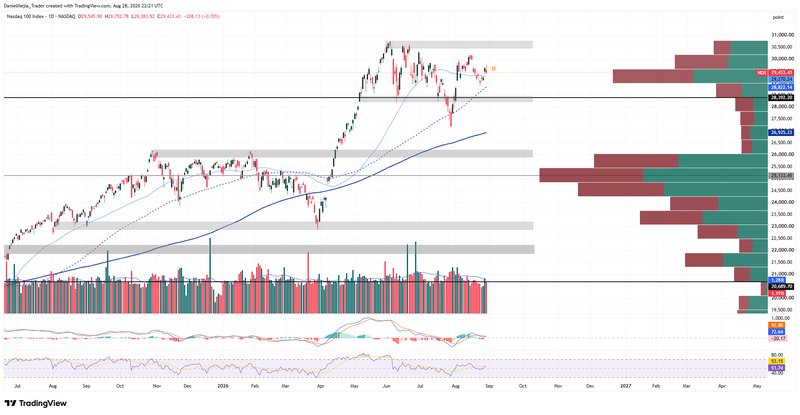
Figure 1. Nasdaq Index (2025–2026). Source: Data from the Nasdaq Exchange; author's analysis conducted via TradingView.