
 Support
 FTSE 100 rises amid easing inflationary pressures in the UK
The UK FTSE 100 index rose 1.24% to 10,716 points as headline inflation eased to 2.6%. Expectations of controlled interest rates, coupled with a resilient labour market, continue to support long-term bullish momentum for the benchmark index.

June headline inflation decelerated to 2.6%, reducing pressure on the Bank of England to adopt a hawkish monetary stance.
The unemployment rate held steady at 4.9% with the addition of 148,000 jobs, demonstrating robust domestic economic resilience.
Lower interest rates decrease corporate borrowing costs and protect equities from heavy valuation discounting.
Date: 22 July 2026
FTSE 100 advances as UK inflation pressures continue to ease
The UK FTSE 100 index advanced by 1.24% to reach 10,716 points following a deceleration in the annual inflation rate, which alleviated pressure on the Bank of England (BoE) to implement a hawkish policy stance. According to data released by the Office for National Statistics (ONS), the headline consumer price index (CPI) eased from 2.8% in May to 2.6% in June on a year-over-year (YoY) basis, coming in below the analyst consensus forecast of 2.7%. Concurrently, core inflation—which strips out volatile items such as energy and unprocessed food—remained unchanged at 2.6% YoY.
Market participants consequently anticipate a more cautious approach from the BoE, given that inflation is moderating while the labour market demonstrates structural resilience. Earlier this week, the ONS reported that the unemployment rate remained steady at 4.9%, while employment change figures exceeded expectations with the addition of approximately 148,000 jobs.
Why the FTSE 100 increases amid an environment of lower interest rates
An environment characterized by lower interest rates is typically beneficial for the equity market. Reduced borrowing costs allow corporate entities to finance expansion projects more efficiently. Furthermore, lower benchmark rates reduce the implied discount rate used in financial modelling, thereby preserving the present value of expected future cash flows and supporting corporate intrinsic valuations.
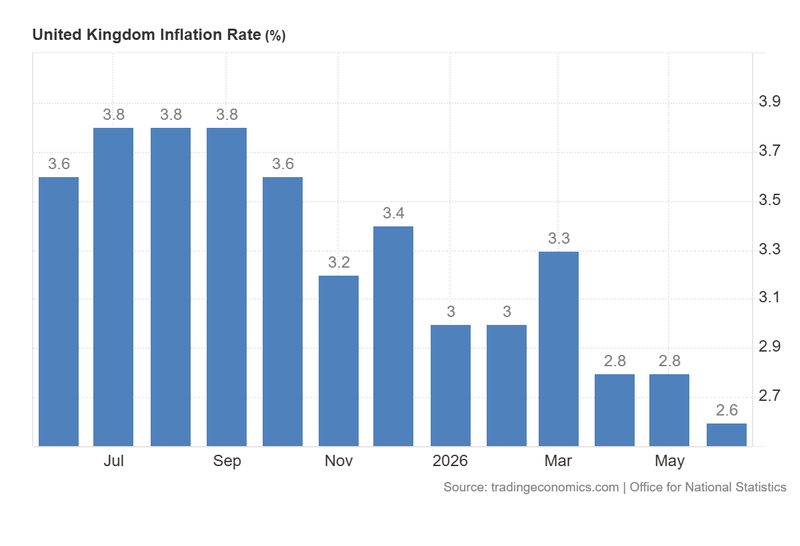
Figure 1. United Kingdom Inflation Rate. Source: Data from the Office for National Statistics; figure obtained from Trading Economics.
Technical analysis of the FTSE 100 index
From a technical perspective, the FTSE 100 index maintains a structurally sound, long-term bullish trajectory.
- Trend Context: Over the long term, the FTSE 100 exhibits a classic ascending market structure defined by a sequence of higher highs and higher lows. The index continues to trade comfortably above its 50-day, 100-day and 200-day Simple Moving Averages (SMAs), reinforcing the prevailing upward trend.
- Resistance Levels: Should the index breach its record high at 10,900 points, the next key resistance ceiling is identified at the psychological 11,500 level. A decisive breakout above these thresholds would mark an entry into price discovery in uncharted territory.
- Support Levels: In the event of a short-term pullback below the 10,500 support level, the primary structural floor sits at 10,100 points—a region that converges with the 200-day SMA. A decisive breakdown below 10,100 would significantly heighten the probability of a deeper market correction.
- Momentum Indicators: Both the Moving Average Convergence Divergence (MACD) and the Relative Strength Index (RSI) display neutral readings, indicating a temporary lack of distinct directional momentum. This aligns with the formation of a five-month ascending triangle pattern.
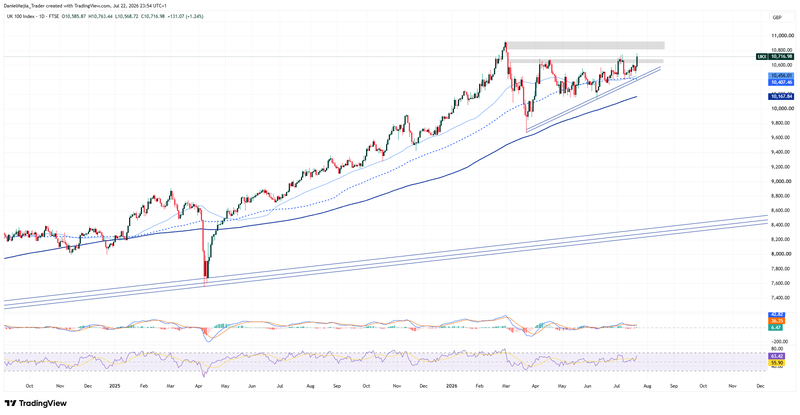
Figure 2. FTSE Index (2025–2026). Source: Own analysis conducted via TradingView.


