
 Support
 FTSE 100 signals uncertainty as inflation drives global bond yields higher
The FTSE 100 fell marginally to 10,680 points as surging global bond yields and inflation fears created widespread market uncertainty, while ongoing geopolitical tensions continued to push up key energy prices worldwide.
Global bond yields have reached multi-year highs across the US, the UK, Europe, and Japan, driven by persistent inflationary pressures.
Sustained inflation and escalating borrowing costs threaten corporate growth and weigh heavily on consumer spending.
Geopolitical conflicts involving US–Iran tensions and the Russia–Ukraine war continue to disrupt energy supplies, driving up crude oil and natural gas prices globally.
Date: 25 September 2026
Are rising inflation and global bond yields weighing on the UK FTSE 100?
The UK FTSE 100 index dropped marginally by 0.24% to 10,680 points amidst escalating uncertainty surrounding rising global bond yields. This international trend is being driven by persistent inflationary pressures, which are prompting central banks to adopt more restrictive monetary policy stances to contain price growth.
In the United States, 10-year Treasury yields reached 5.20%—their highest level since 2007. In the United Kingdom, 10-year government bond (gilt) yields advanced to the 5.38% level, entering a multi-year high zone. Across Europe, 10-year benchmark government bond yields reached 3.60%, marking their highest level since 2009. Meanwhile, in Japan, 10-year government bond yields climbed to the 3.09% mark, reaching a level not observed in approximately 30 years.
This market environment is raising significant concerns amongst market participants, as elevated interest rates create an unfavourable backdrop for corporate performance. As credit becomes increasingly expensive, business expansion projects are curtailed, whilst domestic consumer spending tends to contract.
Alongside this macroeconomic backdrop, major geopolitical conflicts persist: namely, the US–Iran conflict in the Middle East and the Russia–Ukraine war. In both instances, severe supply disruptions are exerting upward pressure on crude oil and natural gas prices. This, in turn, intensifies global inflationary pressures, with a particularly pronounced impact on European economies that remain highly dependent on energy imports.
Notably, although the Bank of England (BoE) has maintained a relatively neutral stance regarding immediate monetary tightening, it stated in its latest policy meeting that further interest rate increases may become necessary should inflationary pressures prove persistent. This has generated renewed expectations amongst investors that the BoE could adopt a more hawkish policy posture in upcoming meetings.
Technical analysis of the FTSE 100 index
From a technical perspective, the FTSE 100 index maintains a structurally long-term bullish trajectory. A detailed examination of the market structure highlights several key technical characteristics:
- Trend Context: Over a macro horizon, the FTSE 100 exhibits a classic ascending market structure characterized by a sequential pattern of higher highs and higher lows. The index continues to trade above its 100-day and 200-day Simple Moving Averages (SMAs), confirming the ongoing integrity of the broader uptrend. However, over a shorter timeframe, the index is forming a technical triangle pattern, reflecting underlying market indecision and uncertainty.
- Resistance Levels: Should the index breach its historical peak near 10,900 points, the next primary technical resistance ceiling is situated at the psychological 11,500 level. A decisive breakout above these boundaries would indicate a higher probability of the index advancing toward elevated valuation zones.
- Support Levels: In the event of a short-term pullback below the 10,600 support, the primary structural floor sits at 10,430 points—a level that aligns closely with the 200-day SMA. A sustained breakdown beneath this support zones would increase the probability of a broader market correction.
- Momentum Indicators: Both the Moving Average Convergence Divergence (MACD) and the Relative Strength Index (RSI) display neutral readings, indicating a period of temporary consolidation. This technical behaviour aligns with the development of a seven-month ascending triangle pattern. Nevertheless, macroeconomic developments and geopolitical factors are expected to remain the primary drivers dictating future market direction.
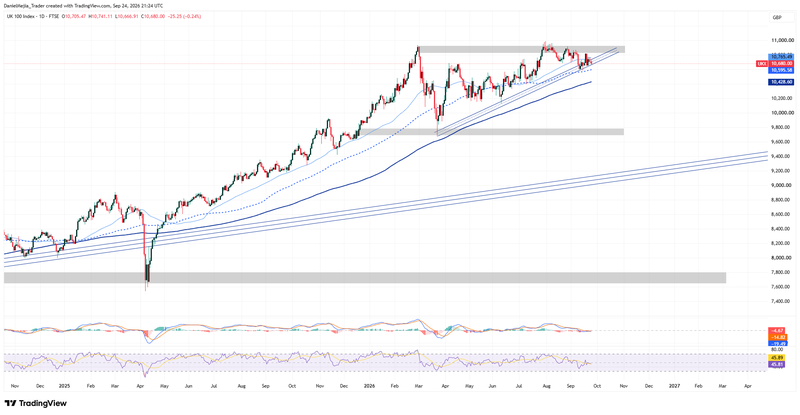
Figure 1. FTSE 100 Index (2025–2026). Source: Author's analysis conducted via TradingView.


