
 Support
 GBP/USD declines as Fed policy turns more restrictive and BoE remains neutral
GBP/USD fell as a restrictive Federal Reserve rate hike contrasted sharply with the Bank of England holding its benchmark interest rate steady at 3.75%.
The Federal Reserve raised its benchmark interest rate to 4.0%, while the Bank of England held steady at 3.75%, driving GBP/USD down by approximately 1.25% over the last four days.
The BoE warned of potential rate hikes if escalating Middle East tensions push early-2027 inflation towards 4.0%.
The BoE's tone aligns with recent rate increases by the Fed and ECB, alongside expected tightening by the Bank of Japan.
Date: 18 September 2026
Why diverging Fed and BoE policy stances are driving GBP/USD lower?
The GBP/USD currency pair is exhibiting a downward trajectory in its short-term performance amid growing divergence between Federal Reserve and Bank of England policy stances. Over the last four days, the pair has accumulated a depreciation of approximately 1.25%, driven by a firmly restrictive tone from the Federal Reserve, which raised its benchmark interest rate to 4.0%.
Conversely, the Bank of England (BoE) decided to maintain its benchmark interest rate at 3.75%, in line with market expectations. The BoE Monetary Policy Committee (MPC) voted 6–3 in favour of keeping rates unchanged, with three dissenting members voting for a 25-basis-point increase.
However, despite holding interest rates steady, the BoE warned that further rate hikes could be required if inflationary pressures intensify due to a prolonged conflict in the Middle East. Notably, as quoted by Reuters, the UK central bank projected that inflation could reach 4.0% early next year. Consequently, the BoE meeting marked a prominent shift in monetary policy stance, leaving the door open to future interest rate increases if price pressures persist.
This renewed hawkish tone aligns with the perspective of both the European Central Bank and the Federal Reserve, both of which have raised benchmark interest rates in recent days. In turn, analysts expect the Bank of Japan to adopt a more restrictive monetary policy decision at its upcoming meeting.
Finally, while economic growth in the United Kingdom remains modest and the labour market exhibits signals of stabilisation, the inflation rate remains well above the BoE's 2.0% target and could double it if the early-2027 forecast of 4.0% materialises.
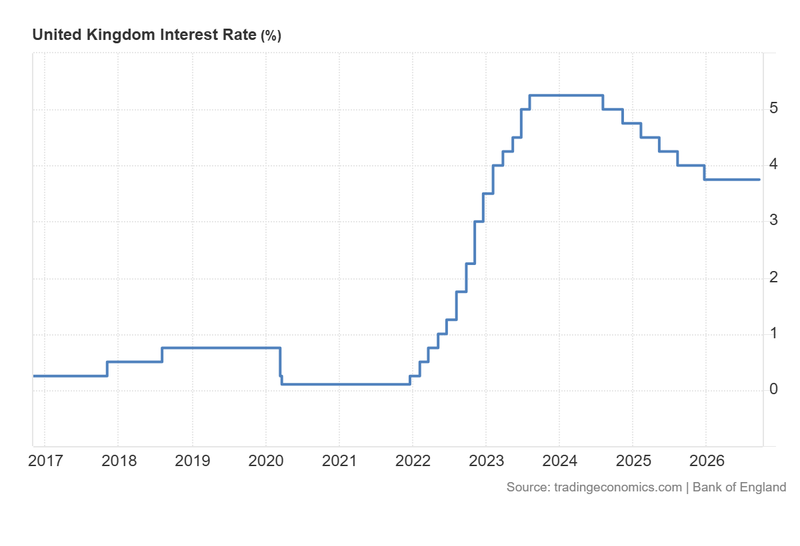
Figure 1. United Kingdom Interest Rate (2016–2026). Source: Data from the Bank of England; figure obtained via Trading Economics.
Technical analysis of the GBP/USD pair
From a technical perspective, the GBP/USD pair continues to trade within a long-term bullish channel. However, immediate market structure reflects a period of consolidation:
- Trend Context: Although the pair maintains a long-term bullish trajectory defined by a sequence of higher highs and higher lows, it is currently oscillating within a consolidation range. Crucially, GBP/USD has lost its short-term bullish momentum, trading below its 50-day, 100-day, and 200-day Simple Moving Averages (SMAs), which reinforces a short-term bearish bias.
- Resistance Levels: Should short-term bullish momentum recover to the upside, the next critical resistance level lies at $1.3450—a level that converges with the 100-day and 200-day SMAs. Above this technical zone, the next major barrier stands at $1.3550. A decisive daily close above these levels would open the probability towards higher price territory.
- Support Levels: Should the short-term bearish trajectory reinforce, key demand floors are located at $1.3324 and $1.3280 (where the floor of the long-term bullish channel pattern stands). A breach below these levels would heighten the probability of a deeper market correction.
- Momentum Indicators: Both the Moving Average Convergence Divergence (MACD) and the Relative Strength Index (RSI) display downward trajectories, suggesting that the short-term retracement could continue or a consolidation phase may ensue. Nevertheless, macroeconomic and geopolitical factors are expected to remain the primary drivers of future price direction.
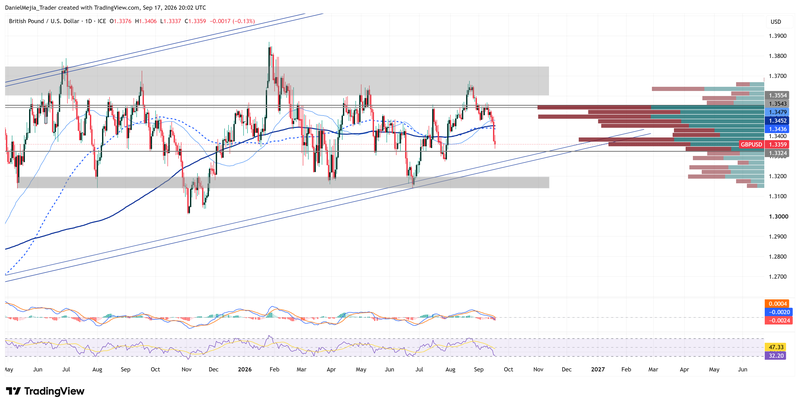
Figure 2. GBP/USD Pair (2025–2026). Source: Data from the Intercontinental Exchange (ICE); author's analysis conducted via TradingView.


