Support
 GBP/USD rises following accelerating UK services PMI
The GBP/USD pair rose to $1.3525 after the UK Services Purchasing Managers' Index (PMI) expanded to 52.5 in August, supported by growth in service output and reduced expectations of an interest rate hike by the US Federal Reserve.
The UK Services PMI rose to 52.5 in August, signalling modest expansion but falling short of market consensus expectations of 52.8.
Input cost inflation accelerated due to rising energy expenses, while employment and export orders declined amid heightened geopolitical uncertainty.
Although GBP/USD appreciated by the market close, the pair remains bound within a consolidation range, pointing to underlying uncertainty in directional price action.
Date: 3 September 2026
Is the UK services sector gaining momentum?
According to data published by S&P Global, the UK Services PMI advanced from 52.1 in July to 52.5 in August, indicating a minor improvement in the performance of the services sector. However, the final reading was updated below analysts' expectations of 52.8 points. In this context, while a reading above the 50.0 threshold implies expansion, the broader historical overview exhibits a downward trend since the beginning of 2024.
An analysis by Trading Economics indicates that there was a moderate expansion in service output and new orders, whereas cost inflation increased amid higher energy expenses. Conversely, exports and employment areas contracted amid high geopolitical uncertainty that has affected confidence among consumers and businesses.
Following the economic release, the British pound appreciated by 0.33% against the US dollar, with the GBP/USD currency pair closing the trading session at $1.3525. This performance signals underlying strength for the UK economy, alongside weakness in the US dollar driven by lower expectations of a Federal Reserve interest rate hike at its forthcoming meeting.
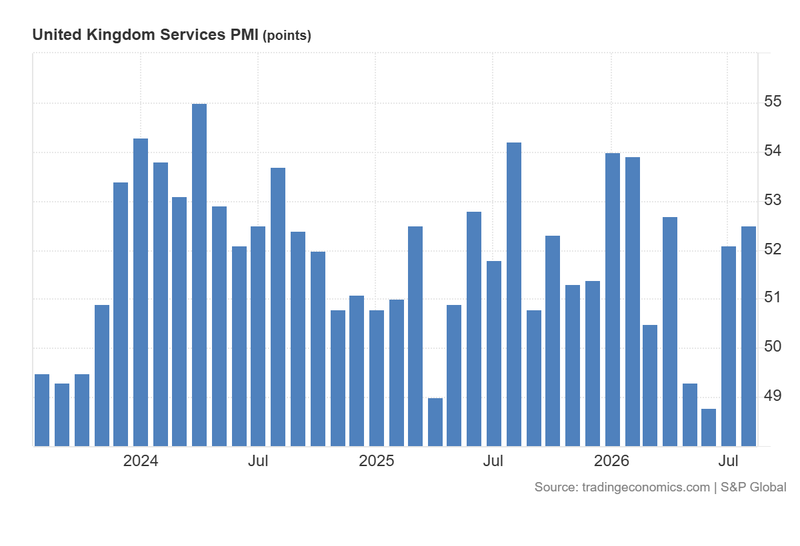
Figure 1. United Kingdom Services PMI (2023–2026). Source: Data from S&P Global; figure obtained from Trading Economics.
Technical analysis of the GBP/USD pair
From a technical perspective, the GBP/USD pair continues to trade within a long-term bullish channel. However, the immediate market structure reflects a phase of consolidation:
- Trend Context: Although the GBP/USD pair maintains a long-term bullish trajectory defined by a sequence of higher highs and higher lows; however, it is currently oscillating within a consolidation range. Consequently, the currency pair is exhibiting market uncertainty regarding a predominant directional trajectory.
- Resistance Levels: Should the short-term resistance zone near $1.3650 be cleared to the upside, the next critical resistance level lies at $1.3850, marking a long-term structural ceiling. A decisive daily close above this threshold would signal a formal resumption of the primary bullish trend and increase the likelihood of movement towards higher price territory.
- Support Levels: In the event of a market retracement, the next critical demand floor is located at $1.3445—a level where the 50, 100, and 200 Simple Moving Averages (SMAs) converge. If this support zone is breached to the downside, the next critical area is $1.3290, where the floor of the bullish channel stands. A breach below these levels would significantly heighten the probability of a deeper market correction.
- Momentum Indicators: Both the Moving Average Convergence Divergence (MACD) and the Relative Strength Index (RSI) display neutral levels, suggesting a lack of a predominant market direction. Therefore, in this environment of uncertainty, macroeconomic and geopolitical factors are expected to remain the prevailing drivers for future directional bias.
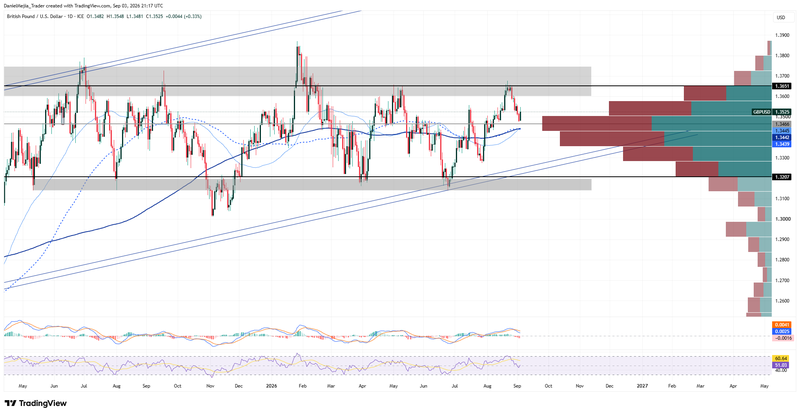
Figure 2. GBP/USD Pair (2025–2026). Source: Data from the Intercontinental Exchange (ICE); author's analysis conducted via TradingView.