Support
Gold rebounds from crucial support amid sharp oil market selloff
Gold rallied to $4,072 as falling oil prices, lower Treasury yields, and a weaker US dollar tempered inflation expectations following the US midterm elections.

Gold futures surged 3.53% to $4,072 as crude oil fell by over 8% on hopes of diplomatic progress in the Middle East.
Brent crude slid to $94.62 and WTI to $88.12 per barrel, raising expectations of a potential moderation in inflationary pressures.
The US Dollar Index fell 0.24% to 101.48, making dollar-denominated bullion more attractive to foreign buyers.
US 10-year Treasury yields fell 7.8 basis points to 4.89%, enhancing the appeal of non-yielding gold as a store of value.
Date: 5 November 2026 (GMT+3)
How is the Oil price impacting Gold's technical outlook?
The gold futures contract (GC) surged by 3.53% to $4,072 following the US midterm elections—where Democrats secured majorities in both the Senate and the House of Representatives—driven by a sharp drop in oil prices and a weakening US Dollar Index (DXY).
Against this backdrop, crude oil prices fell markedly on optimism that inflationary pressures might subside following potential diplomatic engagement between Washington and Tehran in the Middle East. Political analysts note that congressional Democrats may seek to restrict funding for military operations, which could complicate the continuation of the conflict.
The Brent crude futures contract (BRN) dropped by 8.67% to $94.62 per barrel, while the West Texas Intermediate (WTI) futures contract (CL) declined by 8.29% to $88.12 per barrel.
Consequently, the US Dollar Index—which tracks dollar behaviour against a basket of major currencies, including the euro, the Japanese yen, and the British pound—declined by 0.24% to 101.48. Lower energy prices could ease pressure on the Federal Reserve regarding the adoption of a more restrictive monetary policy stance should inflation decelerate. Concurrently, 10-year US Treasury yields fell by 7.8 basis points to 4.89%, reinforcing the hypothesis that inflationary pressures may subside.
Bullion typically benefits from a weaker US dollar, as the precious metal becomes more attractive for institutional market participants. Furthermore, gold prices generally appreciate in an environment of lower Treasury yields, as the asset becomes relatively more attractive as a store of value.
Notably, gold is testing and rejecting a key technical floor near $3,940—a structural support zone where an ascending long-term trendline converges with the Volume Profile's Point of Control (POC).
Technical analysis of Gold
From a technical perspective, gold futures maintain an ascending trajectory above a long-term trendline. A structural analysis of the current market highlights the following key dynamics:
- Trend context: On daily timeframes, gold exhibits an ascending trajectory following a bullish rejection of a long-term upward trendline. Nevertheless, bullion has faced notable selling pressure recently, driving the price below its 50-day, 100-day, and 200-day Simple Moving Averages (SMAs) and indicating that broader momentum remains bearish. Against this backdrop, the price rejected a crucial support zone near $3,940, where structural support, the ascending long-term trendline, and the Volume Profile's POC converge.
- Momentum Indicators: Both the Moving Average Convergence Divergence (MACD) and the Relative Strength Index (RSI) are turning upwards from depressed levels, suggesting that short-term bullish momentum could reinforce. The RSI is recovering from oversold territory, while the MACD displays a bullish divergence, increasing the likelihood of a short-term price recovery.
- Resistance levels: Should bullish momentum persist, the immediate technical ceiling is identified at $4,236—a level where the 50-day and 100-day SMAs converge. A breakout above this threshold would open the path towards the next major resistance at $4,500, coinciding with the 200-day SMA.
- Support levels: Should selling pressure intensify, primary structural support remains at $3,940. A decisive breakdown below this level would expose the next key support zone at $3,700, which aligns with a prominent High Volume Node (HVN).
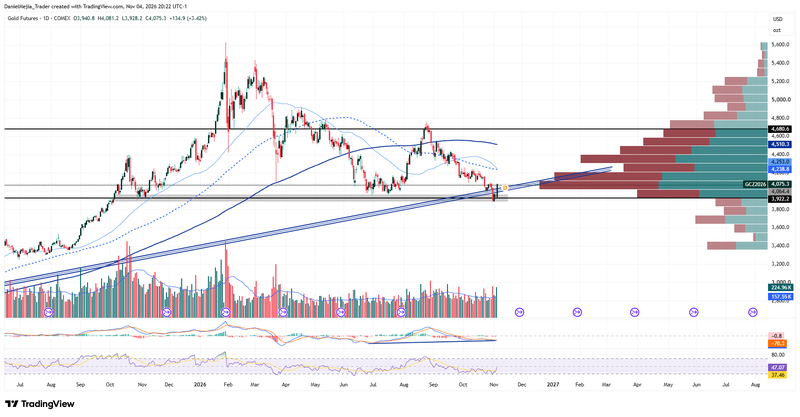
Figure 1. Gold Futures Contract (2025–2026). Source: Data from COMEX Exchange; author's analysis via TradingView.