Gold retreats to the $4,000 level as US dollar strength re-emerges
Gold retreated towards $4,000 as renewed dollar strength and rising expectations of a more hawkish Federal Reserve reduced demand for non-yielding assets. Markets are now focused on the forthcoming PCE inflation release.

Gold fell towards $4,000, its lowest level since November 2025, as stronger expectations of Federal Reserve tightening weighed on bullion demand.
CME FedWatch priced the highest probability of a September rate hike at 49.2%, while investors awaited the 25 June PCE inflation report.
The DXY rose by 0.20% to 101.57, its highest level since May 2025, making dollar-denominated gold more expensive for global buyers.
Gold falls to the $4,000 threshold amid renewed US dollar strength
The gold futures contract (GCQ6) fell towards the $4,000 threshold, a level not seen since November 2025. Bullion has been pressured by rising expectations that the Federal Reserve (Fed) will adopt a more hawkish stance in order to contain inflationary pressures. A restrictive Fed context tends to weigh on gold prices, as government bonds become more attractive in a high-yield environment and the opportunity cost of holding the precious metal increases.
According to CME’s FedWatch Tool, market-implied probabilities are pricing in a 25-basis-point interest rate hike at the Fed’s September meeting, with the highest probability standing at 49.2%. Market participants are now focused on the PCE Price Index update, which will be released by the US Bureau of Economic Analysis (BEA) on Thursday, 25 June.
In addition, the gold futures contract has been pressured by the appreciation of the US dollar. At market close, the dollar index—a basket that compares the US dollar against major currencies such as the euro, British pound, and Japanese yen—advanced by 0.20% to 101.57 points, a level not seen since May 2025. Bullion tends to be negatively affected by a stronger greenback, as it becomes more expensive for global investors given that gold is denominated in US dollars.
Technical analysis of Gold
From a technical perspective, gold futures continue to maintain a robust long-term bullish trajectory, although current selling pressure is driving a significant market retracement. A detailed analysis of the current market structure reveals several key observations:
- Trend context: On daily timeframes, gold exhibits a bullish market structure defined by a clear sequence of higher highs and higher lows. However, price action is now breaking below its 50-day, 100-day, and 200-day Simple Moving Averages (SMAs), suggesting that bearish pressure is becoming increasingly relevant.
- Resistance levels: Should the immediate short-term resistance at $4,390 be breached to the upside, the next significant technical ceiling is identified at $4,500—a technical resistance level where the 200-day SMA converges. A sustained close above this threshold would signal the potential for a further extension towards higher valuation levels.
- Support levels: In the event of a deeper price contraction, immediate short-term support is located at the $3,900 level. If this zone is invalidated, the next critical structural floor lies at $3,400. A structural break below these zones would notably increase the probability of a broader market correction.
- Momentum and volume: The Moving Average Convergence Divergence (MACD) is exhibiting a bullish divergence, suggesting that a potential short-term recovery could occur. In turn, the Relative Strength Index (RSI) is trading in oversold territory, reinforcing the possibility of a potential bullish reaction. Meanwhile, the volume profile exhibits a high-volume node (HVN) at the $4,000 price level, strengthening this support zone.
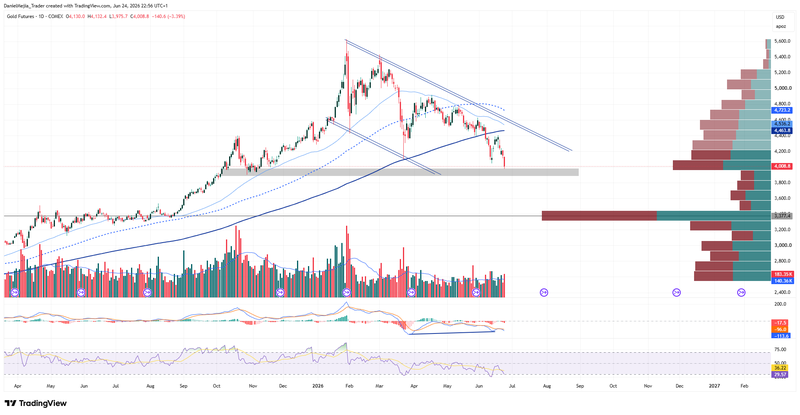
Figure 1. Gold Futures Contract (2025–2026). Source: Data from the COMEX Exchange; own analysis conducted via TradingView.


