
 Support
 Japan’s trade balance falls short of market expectations; Nikkei advances
Japan’s July 2026 trade deficit widened to ¥634.5 billion due to soaring crude oil imports. However, the figure came in below market expectations, while robust exports of artificial intelligence (AI) chips helped lift the Nikkei 225 index.

Japan’s trade deficit reached ¥634.5 billion, remaining narrower than the market-projected deficit of ¥680 billion.
Imports jumped 27.8% year-on-year, driven by an 87.8% surge in crude oil costs amidst Middle East risks.
Exports rose 23.2%, buoyed by strong global demand for AI-related semiconductors and a weak Japanese yen.
Date: 20 August 2026
Japanese balance of trade falls less than market expectations
According to data released by the Ministry of Finance of Japan, the national balance of trade registered a further commercial deficit, widening from ¥409.9 billion in June to ¥634.5 billion in July—its weakest level since January 2026. However, this updated deficit was narrower than anticipated by market analysts, whose consensus forecast stood at ¥680 billion.
This outcome stemmed from a higher-than-expected 27.8% year-on-year increase in imports—the sharpest expansion since November 2022—driven by an 87.8% surge in the value of crude oil imports, as reported by Trading Economics. The Japanese economy continues to be impacted by the ongoing US–Iran conflict in the Middle East, given the Asian nation’s heavy reliance on imported energy.
Conversely, exports advanced by 23.2%, propelled by robust demand for AI-related semiconductors and a weak Japanese yen. Following the economic release, the benchmark Nikkei 225 stock index rose by 1.35% to close at 66,200.
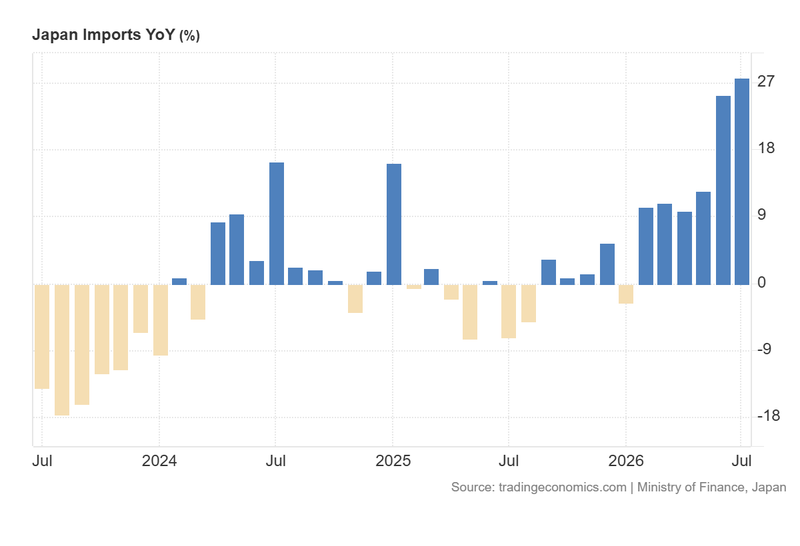
Figure 1. Japan Imports (2023–2026). Source: Data from the Ministry of Finance of Japan; figure retrieved from Trading Economics.
Technical analysis of the Nikkei 225 index
From a technical perspective, the Nikkei 225 continues to display a robust long-term bullish trajectory. A detailed analysis of the current market structure reveals the following key observations:
- Trend Context: Over the long term, the index remains firmly locked in an uptrend, defined by a structural sequence of higher highs and higher lows. It is currently trading comfortably above its 100-day and 200-day Simple Moving Averages (SMAs), confirming that underlying bullish momentum remains intact. However, a range-bound consolidation pattern is currently playing a prominent role in the price action.
- Resistance Levels: Should the index resume its ascent and surpass resistance near 68,700 points, the next critical technical ceiling is identified at the record high of 72,300 points. A decisive breakout above these zones would indicate a potential extension into uncharted price territory.
- Support Levels: In the event that the index undergoes an extended market retracement, immediate short-term structural support is located at 63,700 points—a level that converges with the 100-day SMA. If this floor is invalidated, the next critical structural support lies at the 60,300-point level. A breach of the 60,300 zone would significantly heighten the probability of a deeper market correction.
- Momentum Indicators: Both the Moving Average Convergence Divergence (MACD) and the Relative Strength Index (RSI) are currently trading at neutral levels, indicating the absence of a predominant directional bias. Consequently, fundamental factors are expected to dictate near-term market direction.
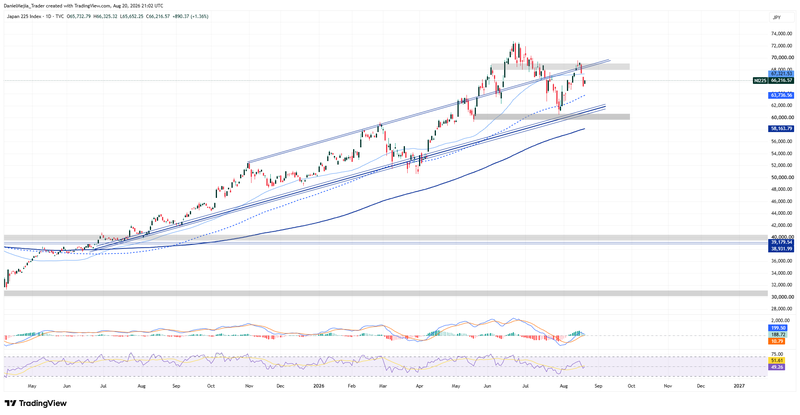
Figure 2. Nikkei 225 Index (2025–2026). Source: Own analysis conducted via TradingView.


