
 Support
 Nasdaq edges lower amid ambiguous Fed remarks and geopolitical tensions
Nasdaq futures fell 2.08% due to Middle East escalation, rising oil prices, and a hawkish hold by the Federal Reserve. Despite a long-term uptrend, short-term momentum signals an ongoing market correction.
Nasdaq futures dropped 2.08% to 27,342, deepening a monthly contraction to approximately 7.5%.
The Federal Reserve held interest rates steady at 3.75% without clear forward guidance, elevating expectations of a September rate hike.
Escalating Middle East strikes pushed Brent and WTI crude oil benchmarks up by over 6% to 7%.
Date: 29 July 2026
Nasdaq falls amid uncertainty over Fed signals and escalating Middle East risks
The Nasdaq futures contract (NQU6) declined by 2.08% to 27,342 amid growing expectations of a more hawkish monetary stance from the Federal Reserve, coupled with escalating geopolitical tensions in the Middle East that continue to drive energy prices higher. Against this backdrop, the index has accumulated a monthly contraction of approximately 7.5%.
The Federal Reserve elected to maintain its benchmark interest rate at 3.75%, aligning with market consensus. However, Chairman Kevin Warsh offered no explicit forward guidance regarding upcoming policy decisions. The decision was backed by a 9-to-3 vote split in favour of a hold over a rate cut. While Chairman Warsh noted that Federal Open Market Committee (FOMC) members view the US economy as solid and resilient, officials expressed ongoing concern regarding inflation rates, which remain above the central bank's 2% target.
Concurrently, geopolitical friction in the Middle East has intensified, posing the risk of a wider regional conflict should Saudi Arabia become directly involved in active hostilities. According to a Reuters report, Iran launched missile strikes targeting US bases across the region, while Saudi Arabia and the US launched a coordinated offensive against Iran-backed armed groups in Iraq. Furthermore, hostilities between Saudi Arabia and Houthi forces persist near the Bab-el-Mandeb Strait in Yemen.
Consequently, major crude benchmarks rallied in tandem. The Brent futures contract (BRNV6) advanced by 7.32% to $88.09 per barrel, while the West Texas Intermediate (WTI) contract (CLU6) rose 6.56% to $84.46 per barrel. Simultaneously, the CME FedWatch Tool indicated a 57% implied probability of a 25-basis-point interest rate hike at the upcoming Federal Reserve September meeting.
Therefore, market participants remain focused on two primary catalysts: the ongoing Q2 earnings season for US equities—particularly firms linked to artificial intelligence development—and persistent geopolitical risks that could pressure a tighter monetary stance from the Fed if energy prices maintain their upward momentum.
Technical analysis of the Nasdaq futures contract
From a technical perspective, the Nasdaq futures contract maintains a structurally long-term bullish trajectory. However, a detailed assessment of the chart highlights key shifts in underlying momentum:
- Trend Context: Over a long horizon, the Nasdaq exhibits a classic ascending structure defined by a succession of higher highs and higher lows. The contract continues to trade above its 200-day Simple Moving Average (SMA), reinforcing its primary bullish trend. Nevertheless, short-term momentum is tracking downward, pointing to a clear contraction in the primary bullish impulse.
- Resistance Levels: Should the contract reverse its immediate decline and resume its upward movement, primary structural resistance rests at 28,400 points. Beyond this level, the next technical ceiling is the record high at the 30,850 mark. A decisive breakout above these thresholds would initiate a new phase of price discovery in uncharted territory.
- Support Levels: If the current retracement extends in the near term, immediate support lies at 26,500 points—where the 200-day SMA converges with a key price action pivot point. Should this zone be invalidated, the next critical structural floor sits at 25,200 points, a level closely aligned with the Volume Profile’s Point of Control (POC). A decisive breach below 25,200 would significantly increase the probability of a deeper market correction.
- Momentum Indicators: Both the Moving Average Convergence Divergence (MACD) and the Relative Strength Index (RSI) are tracking downward, though they are approaching oversold territory. Nevertheless, fundamental drivers are expected to exert a predominant influence over the technical market structure.
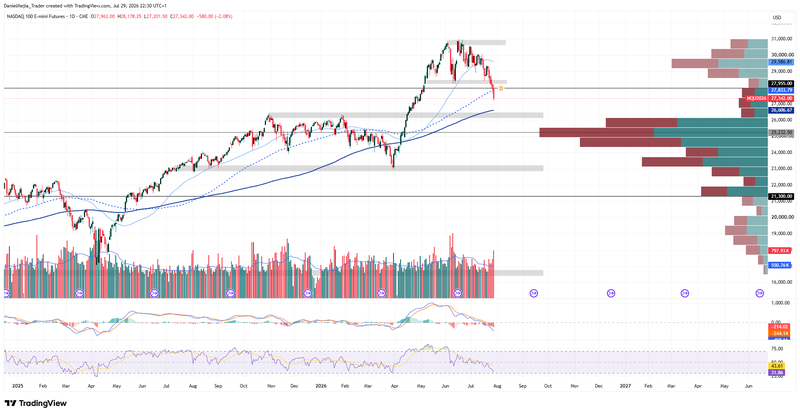
Figure 1. Nasdaq Futures Contract (2025–2026). Source: Data from CME Group; own analysis conducted via TradingView.


