
 Support
 Silver price analysis: will $60.90 hold this week?
Silver is entering this week with two very different forces pulling on its price. The first is Federal Reserve and markets are focused on how another rate decision could affect real yields and the dollar. The second is physical market expects to record its sixth consecutive annual deficit in 2026.
Silver ETF recorded a $29 million outflow in the five trading days through September.
Silver Institute also warns that high prices can become self-defeating.
If silver closes decisively below 60.90. That would suggest the correction is expanding rather than ending and bringing 54.50 back.
ETF flows are cooling, but the shortage has not disappeared
The largest silver ETF recorded a $29 million outflow in the five trading days through September 8, even as major gold ETFs attracted almost $2 billion. That divergence matters because silver is more sensitive than gold to both investment positioning and industrial expectations.
But one week of outflows does not erase a multi-year physical deficit
The Silver Institute expects mine supply to remain broadly constrained in 2026, while industrial demand is being reshaped by high prices, particularly through lower silver usage in photovoltaics. The market can therefore experience weaker investment flows without suddenly becoming well supplied.
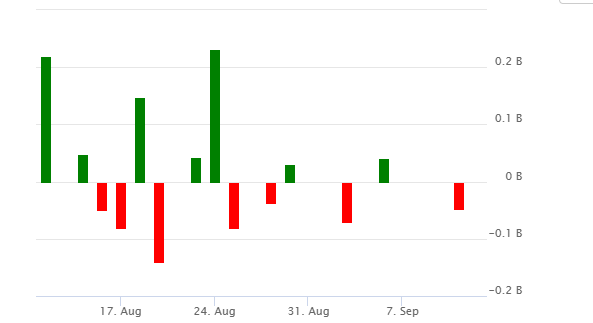
Source: ETFdb
Why can silver supply not respond quickly?
This is the part often missed in rate-driven silver analysis. A large share of silver is produced as a by-product of lead, zinc, copper and gold mining. That means a higher silver price does not automatically persuade miners to open new silver mines.
Production decisions are driven largely by the economics of the primary metals. Even if silver prices rise sharply, additional supply may take years to arrive.
The Fed controls the paper price, not the physical market
This is why Wednesday's FOMC decision needs to be put into perspective. A hawkish Fed could lift real yields and strengthen the dollar, putting immediate pressure on futures prices.
A dovish signal could do the opposite
That is the paper silver market responding to the cost of money. The physical market operates on a different clock. Its warning signs appear through declining inventories, tighter availability, premiums and stronger competition for deliverable metal.
The two prices can diverge for a surprisingly long time. But they cannot remain disconnected indefinitely. Eventually, futures pricing must reconcile with the quantity of physical metal available to satisfy demand.
The bigger risk for silver is not one rate hike
The more important question is whether tighter monetary conditions persist long enough to weaken investment demand substantially.
That matters because the Silver Institute also warns that high prices can become self-defeating. Industrial substitutions, weaker jewelry demand and softer physical investment could eventually reduce consumption.
But even that scenario does not necessarily eliminate the structural deficit. It changes its size.
Technical outlook
Silver has reached one of the most important points on the chart since the rally began from the 54.50 low. The advance into 71.68 completed what looks like a five-wave impulsive move, and the rejection from that area has shifted the market into an ABC correction instead of extending the rally immediately.
The encouraging part is where the pullback is happening
Price has returned to the 60.90–63.20 zone, where previous resistance, Fibonacci retracement levels and the broader recovery structure all begin to overlap. That makes this area much more important than an ordinary support level. If buyers respond here, the correction starts looking like a pause within a larger uptrend rather than the beginning of a new bearish cycle.
Scenarios ahead
The strongest setup would be for Wave (C) to finish around 60.90, where buyers have already started responding. Holding that floor would preserve the broader Elliott Wave structure and create room for a new impulsive leg higher.
The first confirmation would come from reclaiming 63.20, followed by a move through 71.68, where the previous rally stalled. If that ceiling gives way, the next projected targets shift toward 90.04, with the longer-term extension pointing to 96.40 as the next major resistance before another consolidation becomes likely.
Losing 60.90 would change the conversation
The alternative view becomes stronger if silver closes decisively below 60.90. That would suggest the correction is expanding rather than ending and bring 54.50 back into focus as the next major support.
A break beneath that level would invalidate much of the current bullish wave count and force a reassessment of the broader recovery. Until that happens, the chart continues to favour treating weakness as a corrective phase rather than evidence that the longer-term bullish structure has failed.
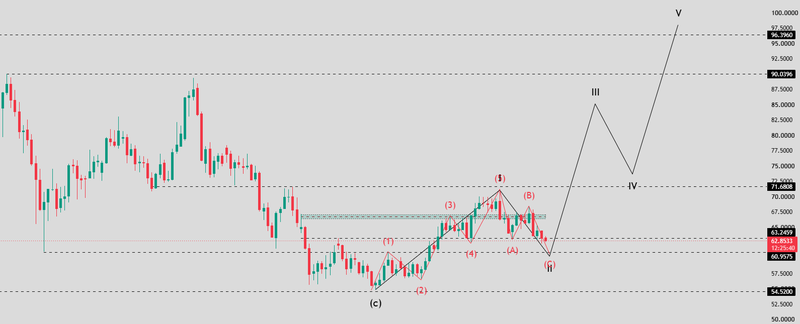
Source: Trading view


