
 Support
 S&P 500 advances to record levels despite market uncertainty
The S&P 500 has reached record highs, driven by AI investment and expectations of strong corporate earnings, despite sticky inflation and elevated US Treasury yields.
S&P 500 futures hit a record 7,875 points, accumulating a year-to-date gain of approximately 13% led by mega-cap AI stocks.
PCE inflation at 3.4% maintains the Federal Reserve's hawkish stance, pushing 10-year Treasury yields to a multi-year high of 5.30%.
Market gains reflect underlying economic resilience and AI data-centre expansion, overshadowing concerns over elevated borrowing costs.
Date: 7 October 2026
Can the S&P 500 sustain its record rally amid economic risks?
The S&P 500 futures contract (ES) reached a new record high following a daily gain of 0.65% to trade at 7,875 points, accumulating a year-to-date (YTD) appreciation of approximately 13%. This robust performance underscores a notable divergence between US equity market participants and bondholders.
On the one hand, US inflation (measured by the PCE Price Index) remains well above the Federal Reserve's 2% target, currently standing at 3.4% as of its August reading. Consequently, the US central bank has adopted a more restrictive monetary policy stance in an effort to contain price pressures. This has generated severe selling pressure in government bonds, as bondholders anticipate further interest rate hikes. As a result, Treasury yields have surged to multi-year highs, with the 10-year government bond yield reaching 5.30%—a level last witnessed in 2002. Furthermore, bondholders continue to express concern over US national debt, which remains at historically elevated levels, placing significant pressure on the federal budget through mounting net interest payments for debt servicing.
On the other hand, equity markets have climbed to fresh record highs, driven primarily by mega-cap technology firms associated with artificial intelligence developments. The S&P 500 index has achieved new all-time highs, whilst the Nasdaq futures contract (NQ) has reached record levels near 31,500 points. Conversely, the Dow Jones Industrial Average continues to lag, maintaining a relative drawdown of approximately 5% from its record peak recorded at the beginning of August.
Against this backdrop, equity investors appear to be weighing resilient US economic productivity—reflected in Gross Domestic Product (GDP) growth driven by robust investment in data centres and AI infrastructure—against the challenging environment of sticky inflation and elevated interest rates. Additionally, market participants may be anticipating a strong third-quarter earnings season, which commences in the coming days, buoyed by the solid financial results reported by US corporations in previous quarters.
Technical analysis of the S&P 500 index
From a technical perspective, the S&P 500 continues to sustain its primary long-term bullish trajectory. Key structural observations include:
- Trend Context: Over the long term, the S&P 500 maintains a robust market structure defined by a sequence of higher highs and higher lows. The index is trading comfortably above its 50-day, 100-day, and 200-day Simple Moving Averages (SMAs), reinforcing the prevailing bullish bias.
- Resistance Levels: Should the index maintain its upward momentum, the next critical technical hurdle is the psychological barrier at 8,000 points. A sustained breach above this level would open the door to further expansion into uncharted territory.
- Support Levels: In the event of a market retracement, immediate support sits at 7,700 and 7,300 (a key short-term structural support level). A breach below these levels would significantly increase the probability of a broader correction.
- Momentum Indicators: The Moving Average Convergence Divergence (MACD) is exhibiting a bearish divergence, indicating that a short-term retracement or consolidation phase may occur. Similarly, the Relative Strength Index (RSI) is trading in overbought territory, signalling caution regarding the sustainability of the current bullish impulse. Nevertheless, macroeconomic and fundamental drivers are likely to remain the primary determinants of the index's trajectory over coming sessions.
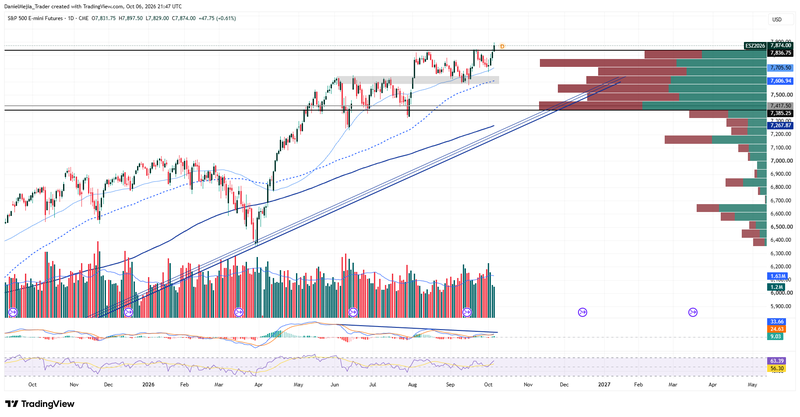
Figure 1. S&P 500 Futures Contract (2025–2026). Source: Data from CME Exchange; author's analysis conducted via TradingView.


