Support
 UK industrial production surges, exceeding analysts’ expectations; GBP/USD jumps
UK industrial production surged by 0.8% in August, beating consensus forecasts and driving GBP/USD to $1.3270.

UK industrial output rose 0.8% month-on-month in August, outperforming broader European economic trends.
Year-on-year industrial production accelerated to 1.6%, driven primarily by basic pharmaceutical manufacturing.
Stable economic growth and 3.1% inflation keep Bank of England interest rates at 3.75%, with potential hikes on the horizon.
Date: 16 October 2026
What is driving the stronger-than-expected rise in UK industrial production?
According to data released by the UK's Office for National Statistics (ONS), industrial production increased by 0.8% month-on-month in August, substantially exceeding the 0.1% contraction anticipated by analyst consensus. Consequently, year-on-year (YoY) industrial output accelerated from 0.8% in July to 1.6% in August, marking its highest reading since November 2025. This reinforces an ascending recovery trend in industrial output over the past three years.
Against this backdrop, the underlying expansion was primarily driven by robust manufacturing output, led by basic pharmaceutical production, as cited by Trading Economics.
Consequently, the growth in UK industrial production stands in contrast to widespread output weakness across the European Union, which reported a contraction over the same period. Although the United Kingdom continues to face persistent inflationary pressures—with headline inflation currently standing at 3.1%—economic growth remains stable. In this context, the Bank of England has held its benchmark interest rate steady at 3.75%, though analysts anticipate potential rate hikes in upcoming policy decisions to contain prices.
Following the ONS release, the British pound appreciated by 0.64% against the US dollar, bolstered by solid industrial output figures and marginal weakness in the greenback. At market close, GBP/USD was trading at $1.3270.
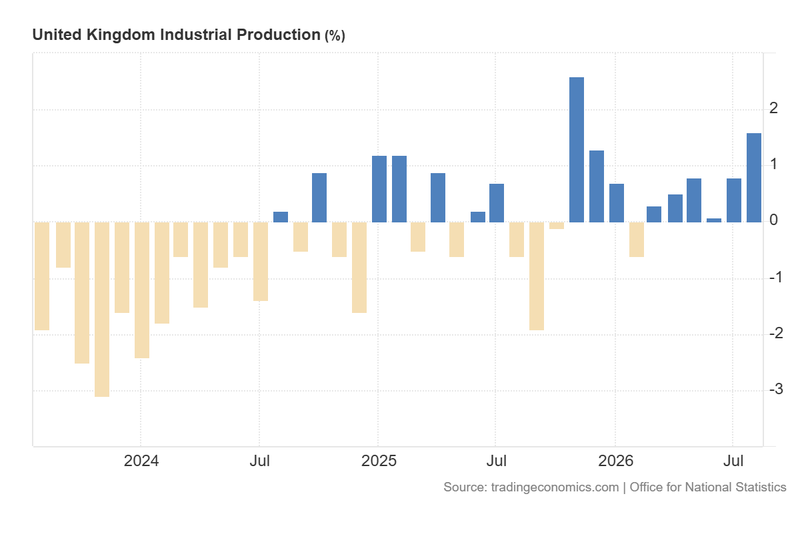
Figure 1. United Kingdom Industrial Production (2023–2026). Source: Data from the UK Office for National Statistics; figure obtained via Trading Economics.
Technical analysis of the GBP/USD pair
From a technical perspective, the GBP/USD pair continues to trade in an ascending trajectory. However, the immediate market structure reflects a phase of consolidation:
- Trend Context: Although the pair maintains a long-term bullish trajectory defined by a sequence of higher highs and higher lows, it is currently oscillating within a consolidation range. Crucially, GBP/USD has lost its short-term bullish momentum, trading below its 50-day, 100-day, and 200-day Simple Moving Averages (SMAs), which reinforces a short-term bearish bias. Additionally, the pair is testing a structural support level that remains near the floor of the bullish channel.
- Momentum Indicators: Both the Moving Average Convergence Divergence (MACD) and the Relative Strength Index (RSI) display inflection points from oversold territory, signalling a potential price recovery or consolidation phase.
- Bullish Scenario: Should short-term bullish momentum resume, the next critical resistance level lies at $1.3300—a long-term bullish trendline that currently serves as a resistance barrier. Above this technical zone, the next major barrier stands at $1.3430, a level where the 200-day SMA converges with the Volume Profile’s Point of Control. A decisive daily close above these levels would increase the probability of higher valuation.
- Bearish Scenario: Should the short-term bearish impulse gain traction, the next critical support level lies at $1.3150, representing long-term structural support. If this zone is breached to the downside, the next technical floor is $1.2750. A break below these levels would heighten the probability of a deeper market correction.
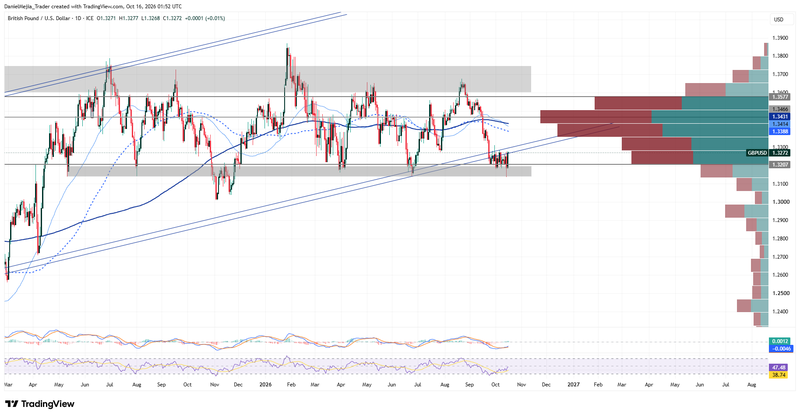
Figure 2. GBP/USD Pair (2025–2026). Source: Data from the Intercontinental Exchange (ICE); author's analysis conducted via TradingView.