Support
US dollar advances on robust job growth and low unemployment
The US Dollar Index rose by 0.70% to 102.28 as strong employment data heightened market expectations of a hawkish interest rate hike by the Federal Reserve at upcoming meeting.
US Non-Farm Payrolls rose by 165,000 in October, significantly beating forecasts.
The US unemployment rate edged down to 4.1%, demonstrating labour market resilience.
The probability of a 25-basis-point interest rate hike reached 78% on the CME FedWatch Tool.
Q3 GDP growth of 3.4% has reinforced expectations of tighter monetary policy.
Date: 7 November 2026 (GMT+3)
Why is the US dollar rising following strong payrolls and low unemployment?
The US Dollar Index (DXY)—which tracks the greenback's performance against a basket of major currencies including the euro, British pound, and Japanese yen—appreciated firmly by 0.70% to 102.28. This advance was primarily driven by rising expectations that the Federal Reserve could adopt a more restrictive monetary policy stance at upcoming meeting, as the US labour market demonstrated continued strength.
According to data released by the US Bureau of Labour Statistics (BLS), Non-Farm Payrolls (NFP) advanced considerably from 60,000 in September to 165,000 in October, comfortably exceeding the 65,000 increase anticipated by analysts. Additionally, the BLS reported that the unemployment rate declined from 4.2% to 4.1%, coming in below consensus expectations of 4.2%. In this context, the unemployment reading reinforced a downward trajectory observed over the past year.
Following the BLS employment report, the CME FedWatch Tool indicated that market-implied probabilities signal a 78% likelihood of the US central bank raising interest rates by 25 basis points, up from 72% several days prior.
Notably, Non-Farm Payrolls were supported by solid job growth in Professional & Business Services (+70,000), Healthcare (+42,000), and Transportation & Warehousing (+24,800). Conversely, the Leisure & Hospitality, Wholesale Trade, and Construction sectors contracted, losing 13,000, 9,100, and 3,000 jobs, respectively. Overall, the services and private segments registered the most significant gains (see Figure 1).
Against this backdrop, the US central bank may focus on price containment rather than full employment, given that the job market remains resilient whilst inflationary pressures continue to mount. Crucially, the US Bureau of Economic Analysis (BEA) recently reported that gross domestic product (GDP) grew at an annualised rate of 3.4% in Q3 2026, exceeding forecasts and signalling sustained economic strength as private investment and domestic consumption continue to expand.
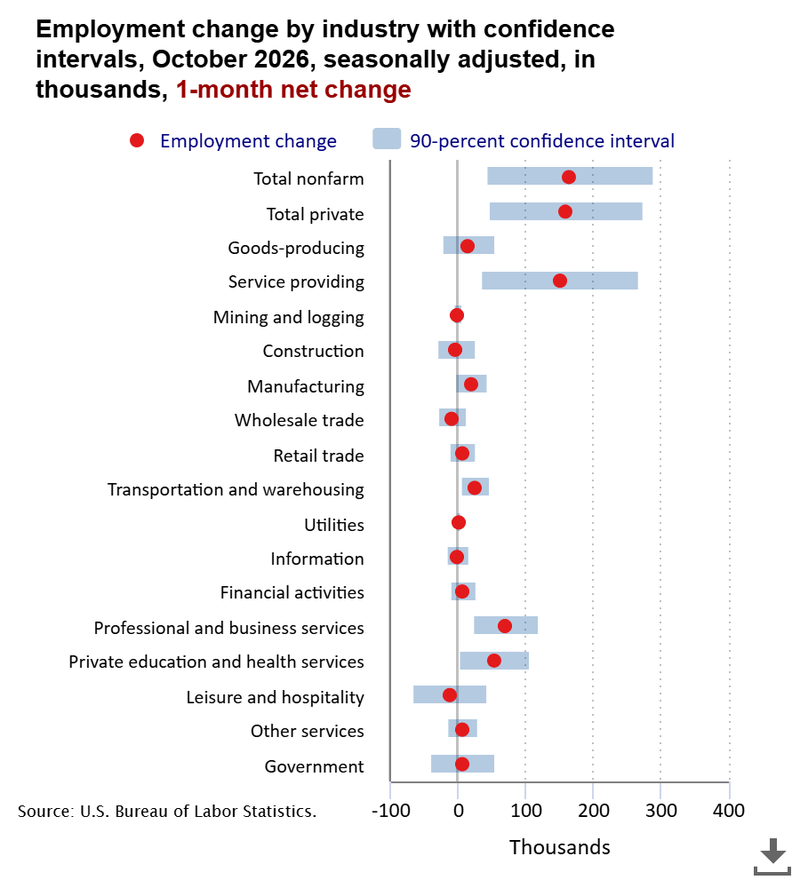
Figure 1. US Employment Change by Industry (October 2026). Source: Figure retrieved from the US Bureau of Labour Statistics' official portal.
Technical perspective on the US dollar index (DXY)
From a technical standpoint, the US Dollar Index exhibits bullish momentum. Key technical observations include:
- Trend Context: On the daily timeframe, the index displays bullish momentum, trading comfortably above its 50-day, 100-day, and 200-day Simple Moving Averages (SMAs). Notably, the DXY has rebounded from prominent structural support levels, maintaining an ascending trajectory year-to-date (YTD).
- Momentum Indicators: Both the Moving Average Convergence Divergence (MACD) and the Relative Strength Index (RSI) are sloping downwards, although both indicators signal a potential inflection point. The MACD line exhibits a slight upward uptick while the histogram has halted its contraction. Concurrently, the RSI is rising after rebounding from the 50-level zone.
- Resistance Levels: Should bullish momentum persist, the next key resistance level is 102.60 (the previous peak), followed by a secondary technical ceiling at 104.00, where a long-term descending trendline aligns.
- Support Levels: Should bearish momentum re-emerge, the primary technical floor is short-term support at 101.20, followed by the 100.00 level—a prominent psychological barrier that converges with the 200-day SMA.
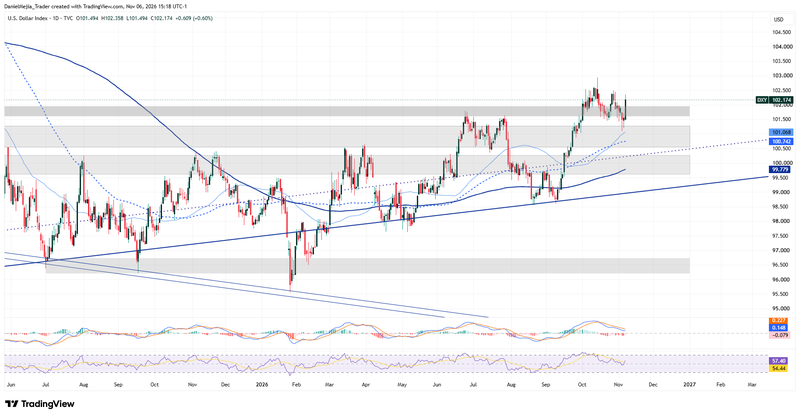
Figure 2. Dollar Index (2025–2026). Source: Intercontinental Exchange (ICE) data; author's analysis via TradingView.