
 Support
Week ahead: ECB leadership, US Core PCE and payrolls to drive global markets
ECB is facing a leadership reshuffle after Schnabel confirmed she will leave in January, while Lagarde has declined to rule out an earlier departure. In the US, jobless claims remain historically low even as Treasury investors have demanded higher yields for longer-dated debt. Japan is also keeping a close watch on the yen, while renewed diplomatic signals from Iran have opened a new variable for oil markets.

ECB leadership is becoming a new policy variable.
U.S. jobless claims remain low despite a softer hiring trend.
USD/JPY remains sensitive to BOJ policy and intervention risk.
Treasury demand is being tested as yields stay elevated.
What moved markets this week?
ECB faces a leadership change at a sensitive time
The ECB's policy debate is now running alongside a leadership reshuffle. Isabel Schnabel will leave on 3 January 2027 for the IMF, while Christine Lagarde has not ruled out leaving before her term ends in October 2027. The timing matters because inflation is still above ECB’s 2% target and energy prices remain at a major risk. Markets therefore must price not only the next rate decision, but who will shape policy as the current leadership cycle comes to an end.
U.S. labour data remain firm
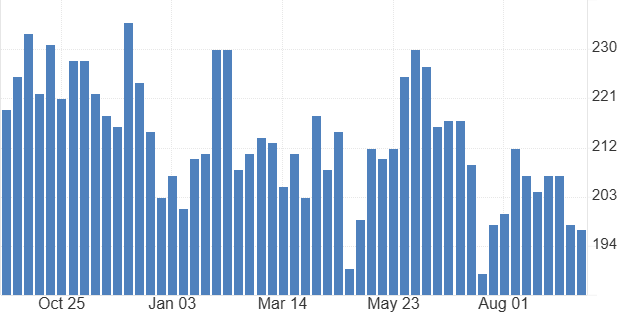
Initial jobless claims fell to 197,000, below the 201,000 expected, while the four-week average dropped to 202,250. August payrolls had already shown 162,000 new jobs with unemployment at 4.1%.
The labour market is slowing, but layoffs remain low. That gives the Fed more time to focus on inflation rather than rushing towards easier policy. The next payroll report will show whether hiring is stabilizing or whether August was simply a stronger month inside a broader slowdown.
Source: U.S. Department of Labor
Japan keeps the yen in focus
Finance Minister Satsuki Katayama said Japan remains in close contact with Washington over currency issues after Donald Trump raised concerns about the weak yen. Tokyo has avoided setting a level that would automatically trigger intervention, leaving markets focused on policy rather than a fixed exchange rate.
With the BOJ expected to tighten further, rising Japanese yields could add to yen demand and make yen-funded carry trades less attractive. The next move in Japanese rates could therefore have a much bigger impact on USD/JPY than official comments alone.
Iran gives oil traders another variable
Iranian President Masoud Pezeshkian said Tehran wants a deal with Washington before the U.S. midterms. Iran has also indicated it could reopen the Strait of Hormuz if Washington reduces military pressure and lifts its blockade on Iranian ports.
The supply problem is not solved, but diplomacy now offers a possible route for crude prices to lose part of their geopolitical premium. That makes oil increasingly sensitive to talks as well as military developments.
Treasury demand is being tested
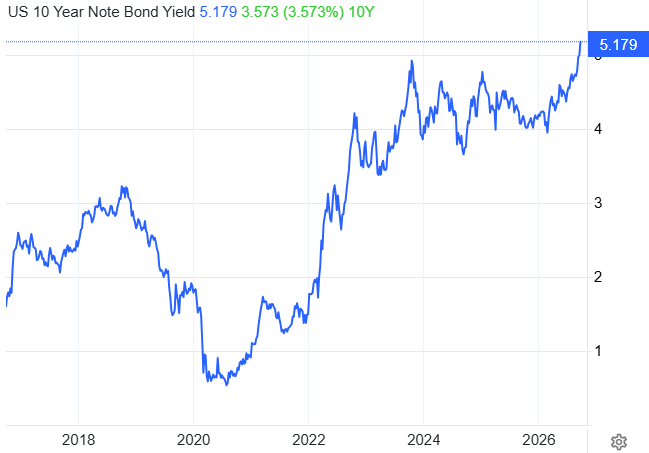
The U.S. sold $70 billion of five-year notes at 5.033%, around 3.1 basis points above the pre-auction yield. The bid-to-cover ratio fell to 2.212, while primary dealers took 15.8% of the issue.
Treasury demand remains solid, but investors are asking for more yield to absorb government debt. With inflation, oil prices and fiscal borrowing all elevated, the bond market is becoming a bigger driver of financial conditions.
Source: Trading economics
What could drive markets next week?
RBA rate decision
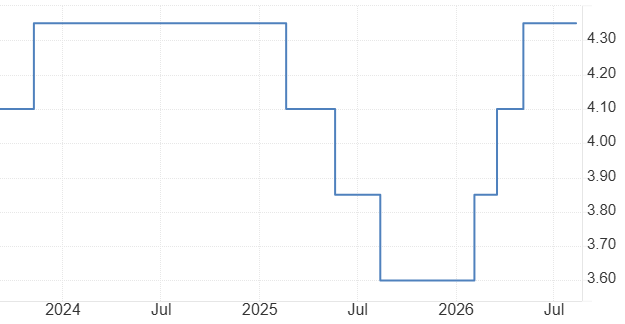
The RBA meets on 29 September, with the cash rate at 4.35%. Markets have been considering a 25bp increase to 4.60%, although expectations have softened after weaker labour data.
Governor Michele Bullock and Assistant Governor Sarah Hunter have both highlighted inflation risks. The rate decision itself may not be the main market event. Guidance will show whether the Bank sees another hike as necessary or expects to hold and assess the impact of previous moves.
Source: Reserve Bank of Australia
U.S. Core PCE
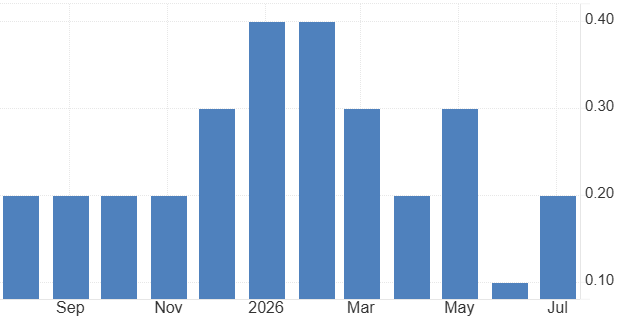
The Core PCE Price Index is due on September 30, with markets expecting a 0.3% monthly increase. After renewed pressure in the latest CPI and PPI reports, the result will test whether inflation is slowing or simply moving sideways above target.
A stronger reading would reinforce expectations that the Fed may need to keep policy restrictive for longer, putting fresh pressure on Treasury yields and the dollar. A softer figure could ease some of that pressure and give risk assets room to recover.
The monthly reading may matter most because markets are focused on the direction of underlying inflation.
Source: U.S. Bureau of Economic Analysis
US final GDP: how strong is domestic demand?
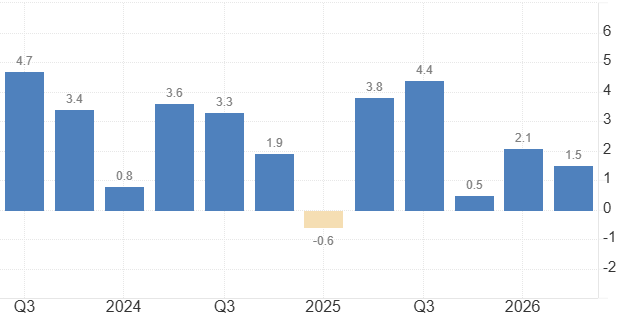
The final estimate of second-quarter US GDP arrives on September 30. The previous estimate showed annualized growth of 1.5%, while real final sales to private domestic purchasers rose 4.2%.
That gap matters because headline GDP suggests slower growth, while domestic demand remains relatively firm. A stronger revision would support the view that the economy can tolerate higher rates without a sharp slowdown, giving the Fed more room to prioritise inflation.
A weaker revision, particularly in domestic demand, would suggest tighter monetary policy is beginning to bite.
The result could therefore influence Treasury yields more through its implications for the Fed than through the GDP number itself.
Source: U.S. Bureau of Economic Analysis
Eurozone inflation: is the energy shock spreading?
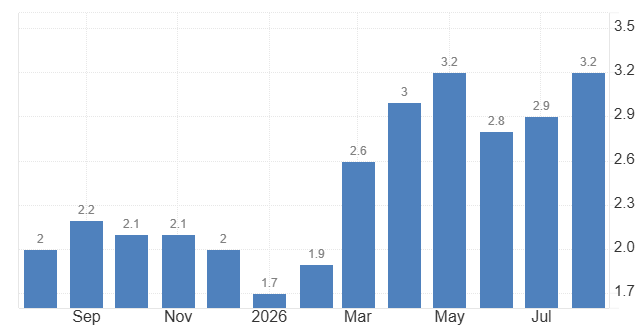
The preliminary September Eurozone inflation report will test whether higher energy prices are creating broader inflation pressure. August headline inflation rose to 3.2%, while energy inflation jumped to 14.3% and core inflation eased to 2.4%.
That split is critical for the ECB
If September inflation rises mainly because of energy, policymakers can still treat much of the pressure as external. If core inflation also accelerates, the risk of second-round effects becomes harder to ignore.
For EUR/USD, the reaction may depend less on the headline number than on whether underlying inflation starts moving in the wrong direction again.
Source: EUROSTAT
US payrolls: is the labour market finally weakening?
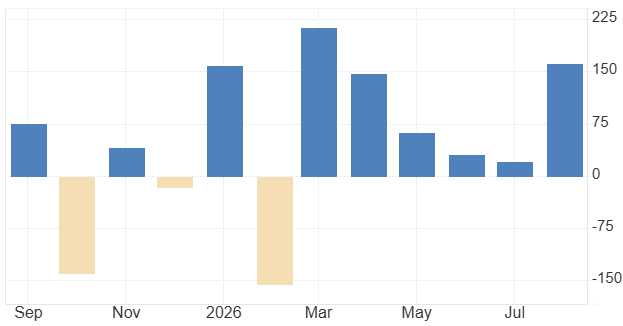
September non-farm payrolls are due on October 2, with markets looking for roughly 90,000 jobs and unemployment near 4.1%.
The combination will matter more than payrolls alone. A sharp slowdown in hiring alongside higher unemployment would strengthen the argument that restrictive policy is beginning to weaken demand, potentially pulling Treasury yields and the dollar lower.
A stronger labour market would reinforce the opposite view, particularly if inflation and oil prices remain elevated.
With the 10-year Treasury already above 5%, the report could become a cross-asset catalyst for bonds, equities and gold by changing expectations for how much further the Fed may need to tighten.
Source: U.S. Bureau of Labor Statistics
ISM Manufacturing: can the rebound hold?
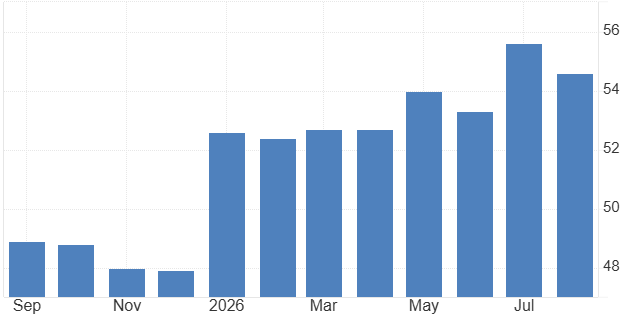
The ISM Manufacturing PMI arrives on October 1 after August's reading of 54.6. The release comes with expectations already elevated after the September S&P Global manufacturing PMI jumped to 57.0, its highest level since May 2022.
A strong ISM would reinforce the view that US activity remains resilient despite high borrowing costs. That would make it easier for the Fed to keep inflation at the centre of policy and could keep Treasury yields elevated.
A weaker reading would raise the possibility that the recent improvement is narrower than the flash survey suggests. The key question is whether manufacturing strength can survive a much higher cost of capital.
Source: Institute for Supply Management
Gold – Technical outlook
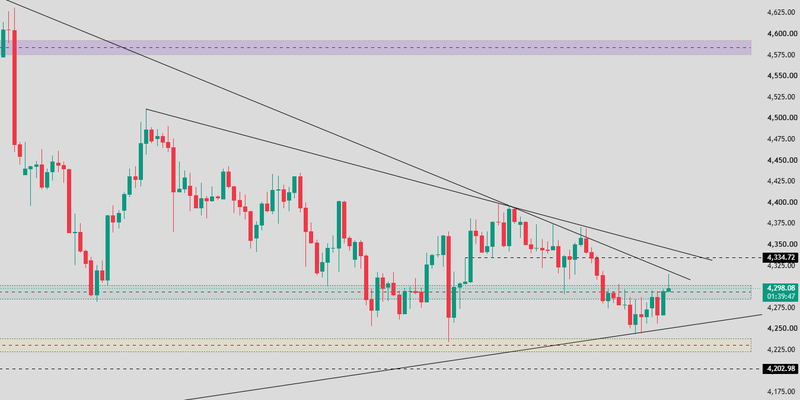
Gold remains trapped inside a contracting structure, with price rebounding from the rising trendline near 4,250 but still trading below two descending resistance lines. The 4,298–4,300 zone is the first barrier, while 4,335 remains the key breakout level that would weaken the bearish sequence of lower highs.
The rising long-term trendline continues supporting buyers, keeping the broader structure balanced despite recent volatility. A sustained move above resistance would strengthen recovery momentum, while rejection keeps focus on the 4,250 and 4,203 support levels.
Source: Trading view
EUR/USD – Technical outlook
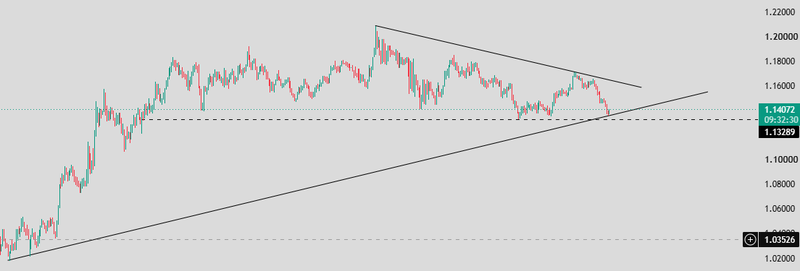
EUR/USD is approaching a key technical inflection point as price tests the confluence of the long-term ascending trendline and the 1.1400 support area. The pair remains trapped beneath a descending trendline that has capped rallies since the 1.20 peak, while buyers continue defending higher lows, creating a tightening triangle.
This compression suggests momentum is building ahead of a larger directional move. Holding above 1.1330 would preserve the constructive structure, while reclaiming 1.1600 would weaken the broader bearish trendline and shift focus toward higher resistance levels.
Source: Trading view
USD/JPY – Technical outlook
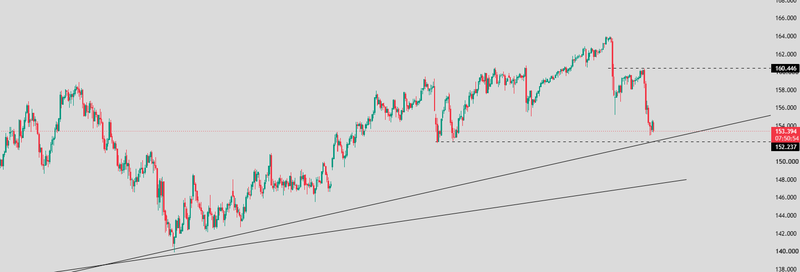
USD/JPY remains in a corrective phase after its sharp reversal from the 164 peak. Price has broken below the short-term ascending trendline but is stabilising above the 152.24 support zone.
The rebound toward 157.60 suggests buyers are attempting to regain control, although 160.45 remains the key resistance that must be reclaimed to restore stronger bullish momentum. As long as 152.24 holds, the broader uptrend remains technically intact despite the recent loss of momentum.
Source: Trading view
Crude Oil – Technical outlook
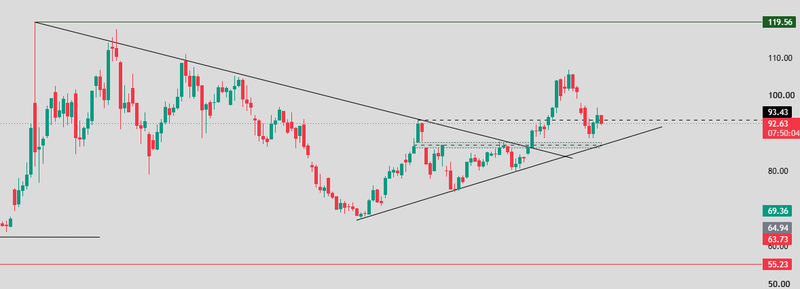
WTI crude remains constructive despite the latest pullback. Price successfully broke out of the multi-month symmetrical triangle, rallied toward 104, and is now retracing toward the 93.43 breakout zone, which is the key level to watch.
The former descending trendline has shifted from resistance to potential support, while the rising trendline from the 69.36 low continues reinforcing the broader recovery structure. As long as 93.43 holds, the breakout remains technically valid, whereas a decisive move below that level would weaken bullish momentum and increase the risk of a deeper correction toward the mid-80s.
Source: Trading view


