Support
 Aroon indicator guide: spot trend changes in trading
The Aroon indicator evaluates the elapsed time between highs and lows on a bounded scale (0% to 100%) to identify prevailing trends, market consolidation, or potential price reversals via line crossovers.
Aroon indicator measures the time elapsed between price highs and lows on a scale from 0% to 100% using Aroon Up and Aroon Down to detect emerging trends and consolidation phases.
Indicator levels above 70% signal a strong directional trend in price, whereas values below 50% reflect periods of market consolidation or lateral movement.
Crossovers between the Aroon Up and Aroon Down lines can anticipate trend reversals, particularly when the dominant line reaches the maximum threshold of 100%.
Because the tool omits traded volume and price momentum strength, the Aroon indicator can be integrated with complementary technical indicators to enhance forecasting probability.
What is the Aroon indicator in trading?
The Aroon indicator quantifies the directional trend behaviour of an asset by assessing the time elapsed between price highs and lows within a specified lookback window. Unlike traditional momentum indicators that measure price velocity or movement strength, the Aroon indicator evaluates whether extreme price movements are actively sustaining a prevailing trend by establishing consecutive, new highs or lows.
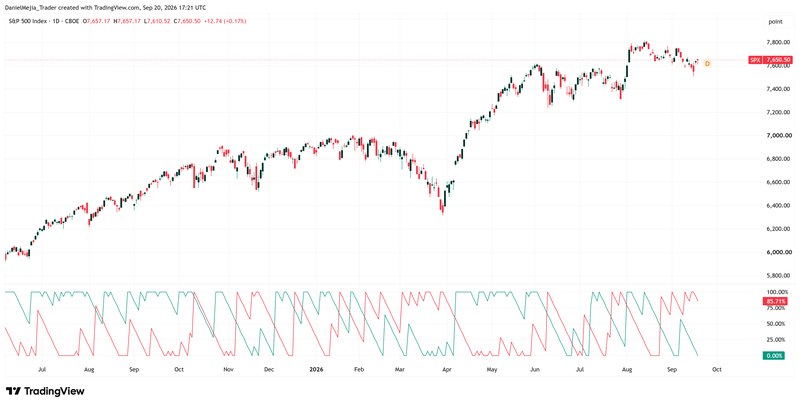
Figure 1. S&P 500 Index (Aroon Indicator Example). Source: Data from the CBOE Exchange; Figure obtained from TradingView.
How is the Aroon indicator calculated?
The Aroon indicator comprises two independent, bounded lines plotted on a percentage scale between 0% and 100%: the Aroon Up and the Aroon Down.
Aroon Up and Aroon Down
The Aroon Up and Aroon Down lines are calculated using the following formulas:
- Aroon Up = [ (N – Periods from Highest High) / N ] * 100
- Aroon Down = [ (N – Periods from Lowest Low) / N ] * 100
Where:
- N: The total lookback period or time window chosen for the calculation.
- Periods Since Highest High: The number of candles or trading periods elapsed since the price reached its highest point within the lookback window.
- Periods Since Lowest Low: The number of candles or trading periods elapsed since the price reached its lowest point within the lookback window.
Calculation example
Assuming a standard time window (N) of 25 periods, where the highest peak occurred 7 periods ago and the lowest trough occurred 15 periods ago, the calculations are as follows:
- Aroon Up = [ (25 – 7) / 25 ] * 100 = 72%
- Aroon Down = [ (25 – 15) / 25 ] * 100 = 40%
In this scenario, the Aroon Up value is significantly higher because the asset is forming higher highs with greater frequency, indicating that the predominant market trend is bullish.
Interpretation of the Aroon indicator
The interpretation of the Aroon indicator can be broken down into several operational insights based on line levels and interactions.
Identifying bullish and bearish trends
To confirm a well-defined, robust trend structure, the dominant line should sit between 70% and 100%, while the opposing line remains suppressed below 30%.
- Strong Bullish Trend: Occurs when Aroon Up holds at or above 70% while Aroon Down remains below 30%.
- Strong Bearish Trend: Occurs when Aroon Down holds between 70% and 100% while Aroon Up stays below 30%.
Detection of consolidation phases and lateral ranges
When both Aroon Up and Aroon Down fall below the 50% threshold, it indicates a phase of market consolidation or range-bound price action. This absence of directional momentum helps traders refine their strategy selection and avoid trend-following errors during non-trending periods.
Crossing signals and transition points
Crossovers between the two Aroon lines signal potential structural shifts in the prevailing trend. A bullish crossover occurs when Aroon Up crosses above Aroon Down. Conversely, a bearish crossover occurs when Aroon Down crosses above Aroon Up. The conviction of such a reversal is reinforced when the new leading line subsequently reaches the 100% boundary.
Trading strategies with the Aroon Indicator and multi-indicator integration
Combining the Aroon indicator with other technical tools can filter false signals and increase the probability of capturing genuine trend movements.
Breakout and crossover system with trend filter
This strategy aims to capture early short- to medium-term directional shifts that align with a broader, long-term trend. Traders look for an Aroon crossover that converges with the direction dictated by a 200-period Simple Moving Average (SMA). For example, if Aroon Up crosses above Aroon Down while the asset trades above its 200-period SMA, a long position may be considered. In this framework, waiting for structural confirmation—such as Aroon Up reaching 100%—helps ensure sufficient momentum.
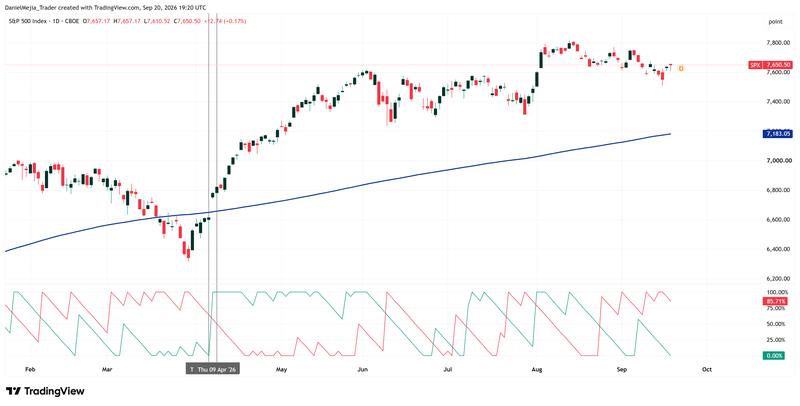
Figure 2. Bullish crossover of the Aroon indicator and price greater than the 200-period SMA (Example). Source: Own analysis conducted via TradingView.
Trend filter for mean reversion
This approach is tailored for non-trending, range-bound market environments. Here, the Aroon indicator acts as a regime filter to permit or restrict secondary mean-reversion signals. For instance, if both Aroon Up and Aroon Down remain below 50%, a trader can deploy range-bound tools—such as Bollinger Bands or the Relative Strength Index (RSI)—to find mean reversion movements with higher confidence.
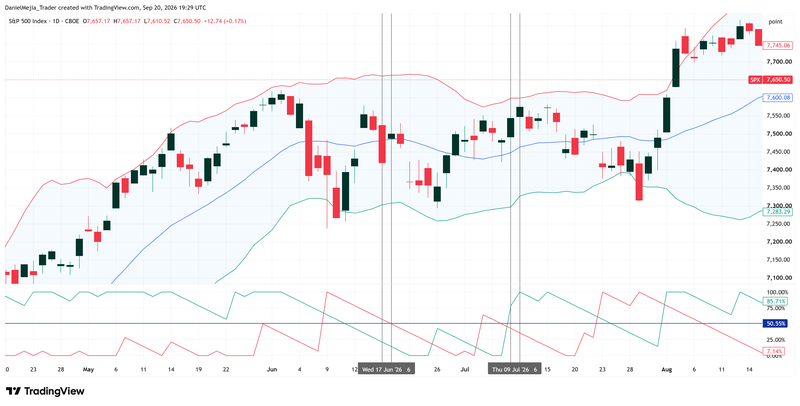
Figure 3. Aroon in laterality and mean reversion indicators (Example). Source: Own analysis conducted via TradingView.
Limitations of the Aroon indicator
While the Aroon indicator offers valuable analytical insights, traders should account for its inherent structural limitations:
- The Aroon indicator does not evaluate price velocity, momentum magnitude, or volume dynamics. Consequently, a line can hit 100% regardless of whether a new high or low was made on heavy institutional volume or negligible retail activity.
- The indicator can occasionally output elevated percentage levels even when price action exhibits choppy, range-bound consolidation, leading to potential lag or false directional bias.
Conclusion
The Aroon indicator is a versatile tool for measuring the temporal recurrence of price highs and lows, allowing traders to evaluate trend durability, pinpoint consolidation phases, and anticipate potential market reversals. However, because it ignores traded volume and movement velocity, its analytical power is maximized when used in tandem with complementary technical indicators. Integrating Aroon into a multi-faceted framework strengthens overall analysis and provides trading strategies with far more robust structural support.
If you're interested in trading indices, foreign exchange, or commodities, consider exploring the CFD contracts offered by Equiti Group. Please note that trading leveraged derivatives involves a high level of risk and may not be suitable for all investors.
FAQs
What is the Aroon indicator and what is it used for?
The Aroon indicator is a technical analysis tool that measures the time elapsed between price highs and lows on a scale from 0% to 100%. It is primarily used to identify the presence of sustained trends, detect non-trending consolidation phases, and spot potential structural turning points in an asset's price.
How do you interpret the levels of Aroon Up and Aroon Down?
Values above 70% reflect a strong directional trend (bullish if Aroon Up dominates, or bearish if Aroon Down dominates). Conversely, when both lines linger below the 50% mark, the indicator reflects a consolidating or range-bound market lacking directional drive.
What do crossovers between the indicator lines represent?
Crossovers between Aroon Up and Aroon Down signal potential shifts or complete reversals in trend direction. These crossover signals carry greater statistical weight when the newly dominant line quickly ascends to the 100% maximum level.
What are the main limitations of the Aroon indicator and how can they be overcome?
The primary limitation of the Aroon indicator is its exclusion of trading volume and price momentum. To mitigate this constraint and optimize entry rules, traders should pair Aroon with contextual filters such as a 200-period Simple Moving Average (SMA) or oscillator-based tools like the Relative Strength Index (RSI).