Support
 A guide to bear market signals and trading strategies
Bear markets are periods of sustained stock market decline, often defined by a 20% drop from a recent high. They can develop when economic conditions weaken, monetary policy tightens and market confidence falls.
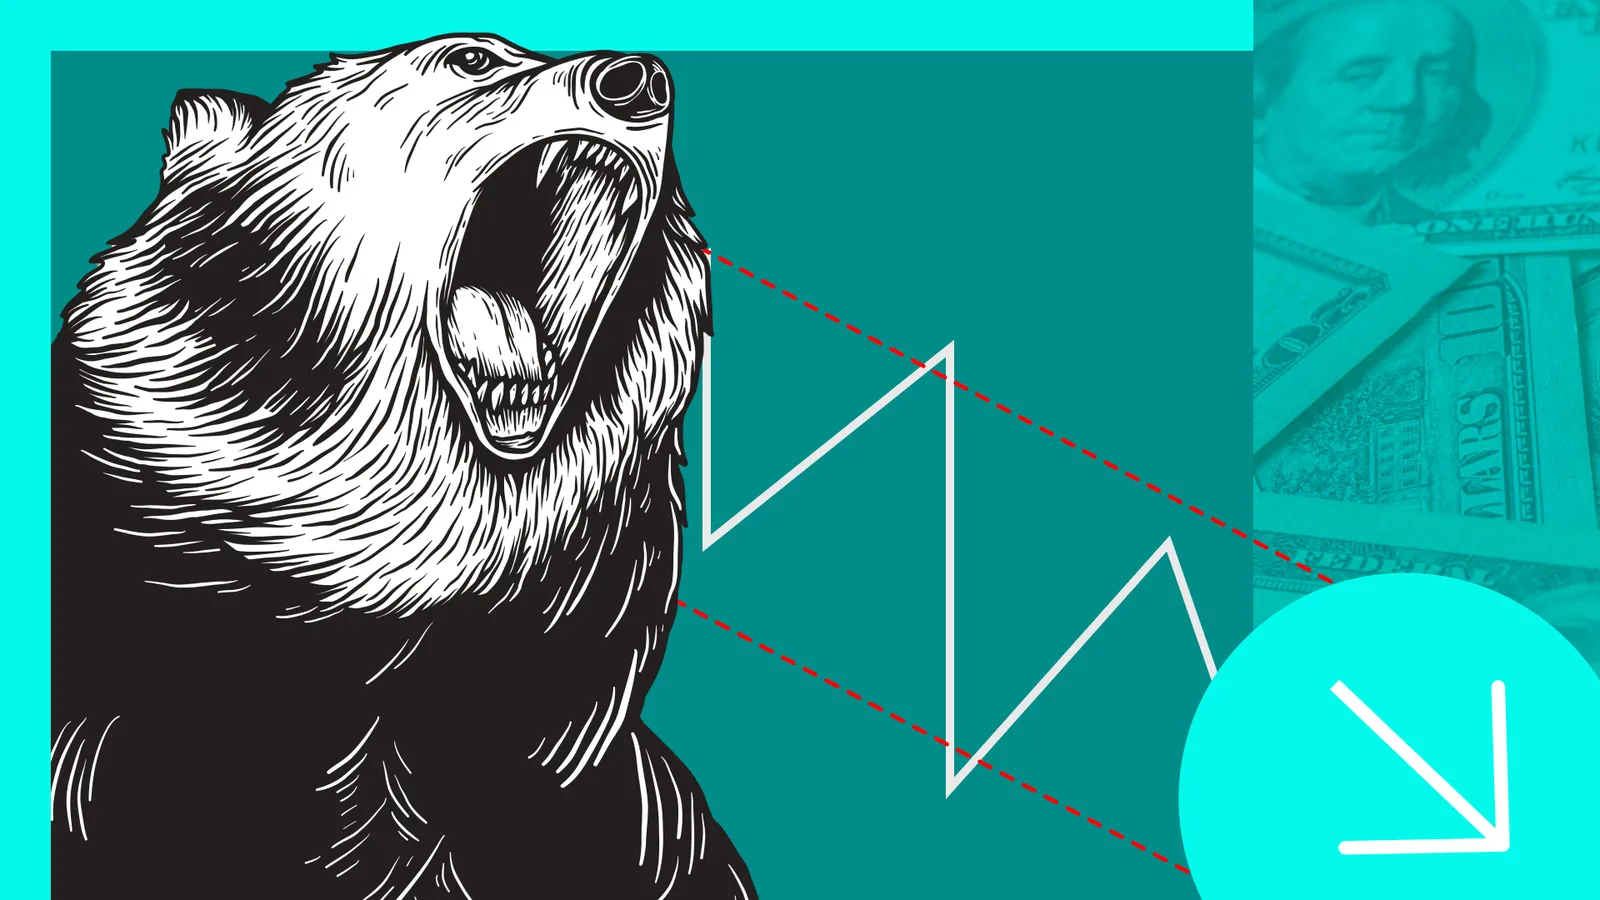
A bear market is usually confirmed when a benchmark index drops 20% or more from its peak, with downturns often described as cyclical or secular.
Higher interest rates and tighter policy conditions can increase the cost of capital, squeeze corporate margins and reduce equity valuations.
Market fear can become self-reinforcing, especially when media coverage heightens concern and encourages panic selling.
Strategic diversification across non-correlated sectors and hedging with derivatives are common ways investors try to limit systemic risk.
Understanding bear markets
The structural dynamics of financial markets are fundamentally driven by alternating upward (appreciating) and downward (contractionary) cycles. When markets undergo a prolonged process of capital depreciation, they enter what is professionally termed a bear market. These prolonged downturns are typically catalysed by deteriorating macroeconomic indicators, pessimistic market sentiment, or weakening financial fundamentals across listed corporations.
What is a bear market?
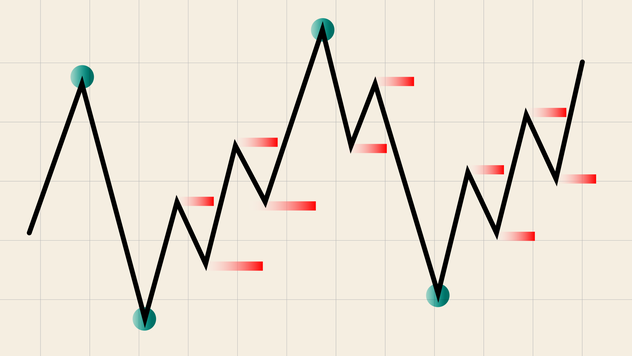
A bear market is technically defined as a cumulative decline of 20% or greater from a recent peak in a benchmark market index. From a technical analysis perspective, this process is characterised by a sequential succession of lower highs and lower lows sustained over an indeterminate period.
Furthermore, bear markets are conventionally classified into two distinct categories based on the temporal horizon over which they unfold. The first category comprises cyclical bear markets, which typically stabilise or achieve capital recovery within several months, moving in tandem with broader economic stabilization. The second category consists of secular bear markets, which can persist for years or even decades. During secular contractions, aggregate market returns regularly track below their historical averages or remain entrenched in negative territory.
Historical examples
A paramount example of historical bear market behaviour can be observed in the United States' S&P 500 Index, a benchmark meticulously monitored by institutional participants globally. Historical datasets reveal several highly relevant bear market epochs, most notably: the 1929 Great Depression, the 1973 Stagflation Crisis, the 2001 Dot-com Bubble collapse, the 2008 Global Financial Crisis, the 2020 pandemic-induced contraction, and the 2022 Inflationary Crisis.
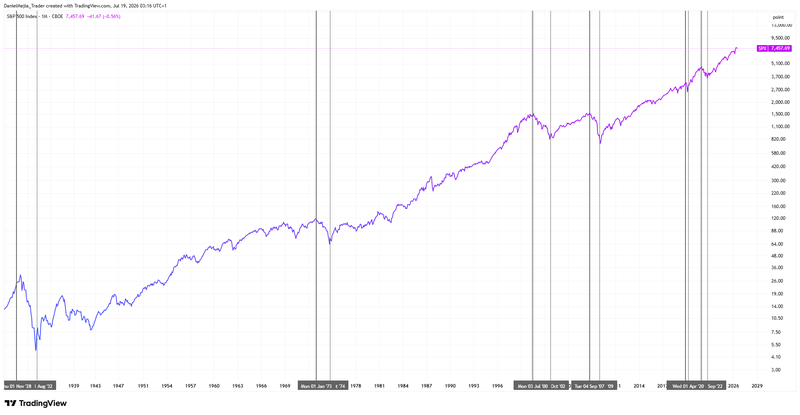
Figure 1. S&P 500 Index’s Bear Markets (1928-2026). Source: Data from the CBOE Exchange. Own analysis conducted via TradingView. Note: Data converted to logarithmic scale for comparison purposes.
Which factors tend to cause bear markets?
The underlying catalysts of bear markets are exceptionally diverse and remain intrinsically tied to the contemporary macroeconomic context in which financial markets operate. Nonetheless, distinct economic, geopolitical, and sentiment-driven factors consistently manifest across historical cycles, irrespective of the specific era.
Economic factors
Equity trends within public markets reflect the foundational laws of supply and demand; consequently, an expansionary or booming economic backdrop supports ascending valuations as market participants deploy surplus capital. Conversely, adverse macroeconomic conditions inherently trigger contractionary movements across asset classes.
A primary, repetitive catalyst is the implementation of restrictive monetary policies—specifically, consecutive increases in reference interest rates by central banks. This tightening increases the cost of money, discourages corporate capital expenditure, and suppresses aggregate consumer demand. The structural result is a compression of corporate profit margins, which subsequently pressures the labour market. In this contractionary environment, equities tend to experience downward pressure, driven either by investors' immediate liquidity requirements or by forward-looking expectations of further price depreciation.
As macroeconomic conditions deteriorate, a nation’s Gross Domestic Product (GDP) may contract. From a technical standpoint, two consecutive quarters of declining real GDP constitute a technical recession, a phenomenon that frequently—though not exclusively—coincides with a broader bear market.
Market sentiment
The analysis of market sentiment is critical to understanding the pivot points between bull and bear market regimes. When collective euphoria dominates the investor base, asset prices frequently ascend irrationally, inflating financial asset bubbles that lack underlying fundamental justification. Conversely, when fear permeates the market, it precipitates rapid and aggressive price declines as participants urgently liquidate their positions to preserve remaining capital.
These cycles of euphoria and fear are heavily exacerbated by prominent media headlines that feed inherent cognitive biases. For example, sudden geopolitical instabilities or military conflicts swiftly induce acute risk aversion, exponentially increasing liquidation pressure. Similarly, protracted trade wars have historically triggered severe market contractions. Although geopolitical and foreign trade disputes eventually impact the real economy, their immediate media prominence tends to trigger aggressive, high-volatility market movements in the short term.
How to identify a bear market?
Although identifying the precise inflection point of a bear market with statistical certainty remains challenging, market professionals rely on specific technical metrics to confirm either its inception or its continuation.
Technical analysis
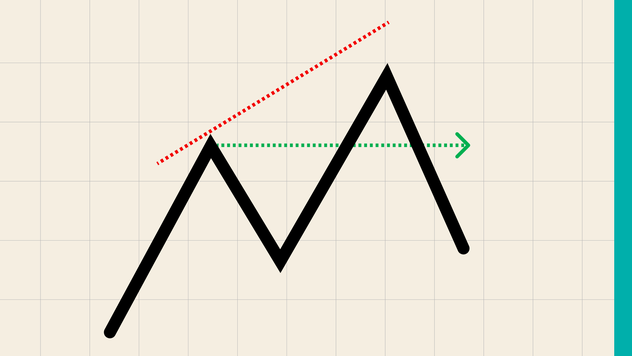
Technical analysis offers various indicators designed to isolate the development of bear markets, yet the Simple Moving Average (SMA) remains one of the most widely adopted metrics due to its quantitative clarity and ease of interpretation. For instance, traders frequently monitor the "Moving Average Crossover" between the 50-period and 200-period SMAs on daily charts to ascertain the primary trend. When the shorter-term moving average crosses below the longer-term moving average, it systematically signals a structural weakening of the prior uptrend and a potential shift toward a primary downtrend.
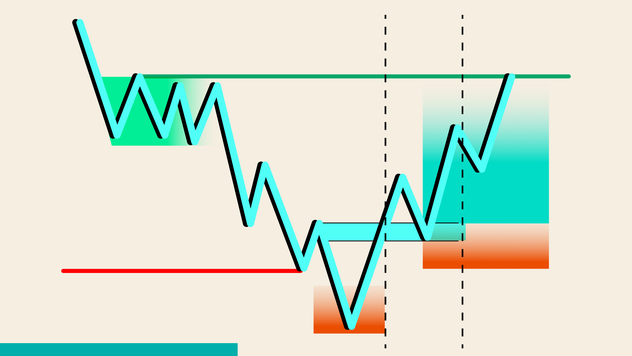
Simultaneously, the continuous charting of lower highs and lower lows in a benchmark equity index provides structural confirmation of a bear market, provided this sequence remains unbroken over time.
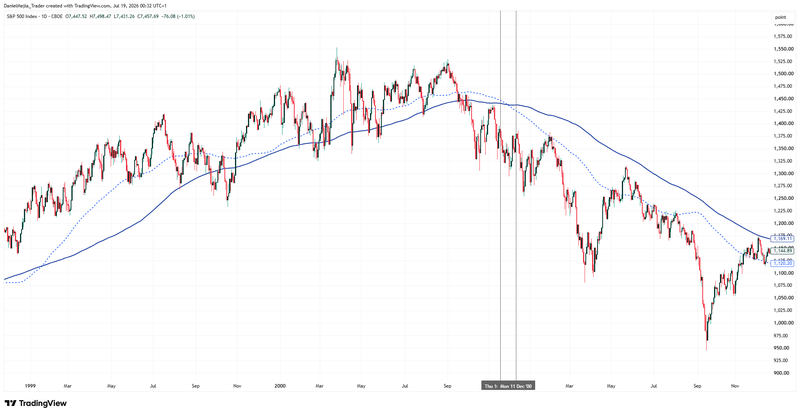
Figure 2. S&P 500 Index’s (1999-2001). Source: Data from the CBOE Exchange. Own analysis conducted via TradingView.
What strategies exist to navigate bear markets?
Long-term investment frameworks during market downturns prioritise capital preservation over the aggressive pursuit of absolute returns. Consequently, sector diversification and strategic hedging constitute the standard operational practices of institutional investors.
Diversification
A diversification strategy centres on constructing investment portfolios comprising asset classes and individual instruments that exhibit low statistical correlation to one another. Rather than concentrating capital within a single enterprise or across multiple firms within an identical industry, diversification requires selecting companies operating across distinct sectors, geographic regions, and financial profiles. Under this framework, if specific equity holdings suffer contractions, the robust performance of counter-cyclical holdings can stabilise the aggregate portfolio valuation.
Nonetheless, it is vital to recognise that asset diversification cannot fully eliminate systemic market risk. During a generalised economic contraction driven by deep systemic factors, the vast majority of equities within a jurisdiction may decline simultaneously as macroeconomic weakness permeates the real economy.
Hedging
A hedging strategy involves deploying financial derivatives that generate positive returns as underlying asset prices decline. When systemic risk triggers widespread capital depreciation, institutional investors acquire derivative instruments such as futures contracts or put options. The profits generated from these short-derivative positions directly offset the capital losses sustained within the primary equity portfolio.
However, this protection introduces distinct trade-offs: should the market defy bearish expectations and continue to appreciate, the derivative contracts will lose their premium or value, thereby capping the aggregate return generated by the long equity portfolio. Consequently, the practical implementation of a hedging framework demands a highly sophisticated analysis of risk metrics and capital allocation parameters.
Conclusion
Successfully navigating a bear market requires an understanding that capital contractions are a structural component of broader financial cycles, systematically driven by macroeconomic shifts and evolving market sentiment. Although identifying the precise onset of a downturn is inherently complex, technical analysis tools provide high-probability validation signals. Lastly, if the priority for investors during these regimes is not the pursuit of profits, but the mitigation of capital impairment, it would be needed rigorous risk management frameworks that combine prudent sector diversification with targeted derivative hedging.
If you're interested in trading indices, foreign exchange, or commodities, consider exploring the CFD contracts offered by Equiti Group. Please note that trading leveraged derivatives involves a high level of risk and may not be suitable for all investors.
FAQs
What exactly is a bear market and how is it classified according to its duration?
A bear market is defined as a cumulative decline of 20% or more from recent peaks in a benchmark equity index, technically distinguished by a continuous chart pattern of lower lows and lower highs. Depending on its temporal frame, it is bifurcated into two classifications: cyclical bear markets, which generally stabilise within several months in alignment with an economic recovery, and secular bear markets, which can endure for years or decades, delivering sustained below-average or absolute negative returns.
How do interest rates influence the emergence of a bear market?
Restrictive monetary policies, characterized by upward adjustments to reference interest rates, increase the cost of credit across the economy. This dampens corporate capital allocation toward expansionary projects and reduces aggregate consumer spending, which compresses corporate net profit margins and stresses employment figures. Faced with a contractionary economic outlook, equity valuations fall as investors either require immediate liquidity or reprice assets in anticipation of further cash flow compression.
What technical tools help identify the development of a bear market?
While predicting absolute market bottoms or tops is exceptionally difficult, technical analysis yields reliable confirmation indicators. A primary tool is the Simple Moving Average (SMA) applied to daily charts, specifically the crossover of the 50-period and 200-period averages. When the 50-day SMA crosses below the 200-day SMA, it indicates substantial bullish exhaustion and a high probability of a structural trend reversal. This shift is further confirmed by the sequential formation of lower highs and lower lows.
How are diversification and hedging strategies different?
Diversification focuses on portfolio construction via low-correlation assets across different industries and geographical regions, ensuring that positive returns in select holdings buffer contractions in others; however, it cannot fully mitigate non-diversifiable, systemic market risk. Conversely, hedging utilizes financial derivatives, such as futures or put options, designed to appreciate directly as asset values fall. This provides explicit capital protection against widespread market declines, though it incurs premium costs that limit total upside potential if the market rises.