Support
Candle range theory (CRT): how to identify and trade the three-candle pattern
Candle Range Theory (CRT) is a price action method that uses the high and low of a candlestick to identify potential trading opportunities. Instead of looking at each candle only as a bullish or bearish movement, traders use its range to identify where price may reverse after breaking a previous high or low.
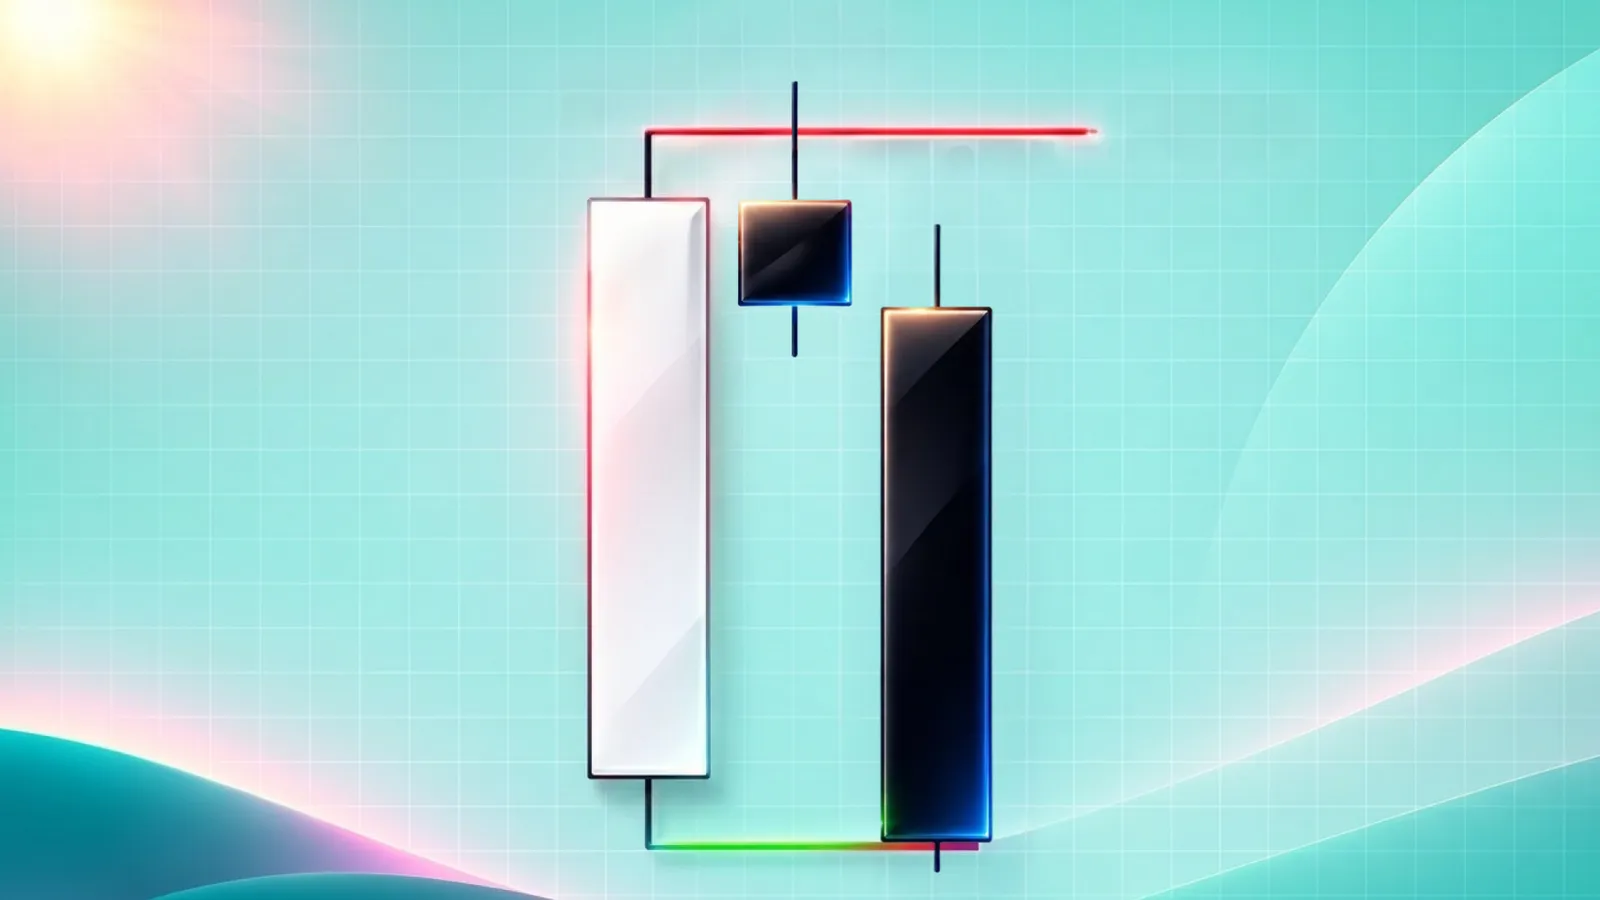
Candle Range Theory treats the high and low of a candlestick as a trading range, with the 50% midpoint acting as an equilibrium level.
The classic CRT pattern consists of three candles: the first establishes the range, the second sweeps liquidity, and the third may move towards the opposite boundary.
Traders often combine CRT with higher-timeframe support and resistance, Fair Value Gaps and Market Structure Shifts to confirm potential entries.
A candle closing back inside the original range is an important part of the setup, but it does not guarantee that price will reach the opposite side.
What is candle range theory (CRT)?
Candle Range Theory (CRT) is an analysis technique that uses the range of a candlestick to find possible liquidity sweeps and reversals.
CRT focuses on the highs and lows of each candlestick and defines boundaries for price movements. A trader can identify high and lows of the past candles to determine the range of the current candle.
For example, if the high and low of a four-hour EUR/USD candle is 1.0900 and 1.0840 respectively, traders can find the boundaries of that candle’s range.
What happens if the next candle trades below 1.0840 and closes within that range? Traders can look for a move to 1.0900. This idea is like Wyckoff Analysis which studies trading ranges, false breakouts, and changes in supply and demand.
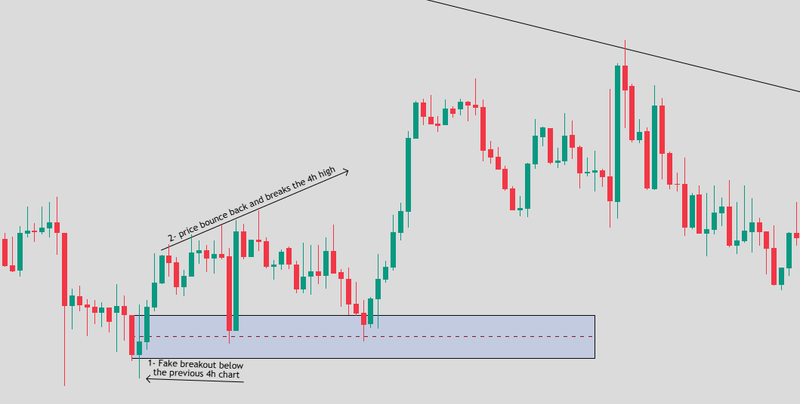
Source: Trading view
What are the CRH, CRL and equilibrium levels?
Candle Range High (CRH) is the highest price reached by the reference candle; traders watch this level because buy-stop orders and stop-losses from short positions may be concentrated above it.
Candle Range Low (CRL) is the lowest price reached by the candle. Sell-stop orders and stop-losses from long positions may be located below this level.
Equilibrium (EQ) is the 50% midpoint between the candle's high and low.
The midpoint is calculated as:
Equilibrium = (Candle High + Candle Low) ÷ 2
Suppose EUR/USD forms a candle with a high of 1.0900 and a low of 1.0840.
The equilibrium would be 1.0870.
Prices above 1.0870 are considered the premium half of that range, while prices below it is considered the discount half.
Traders may use the midpoint as an initial profit target or to assess whether price has moved far enough into the range to support a potential reversal.
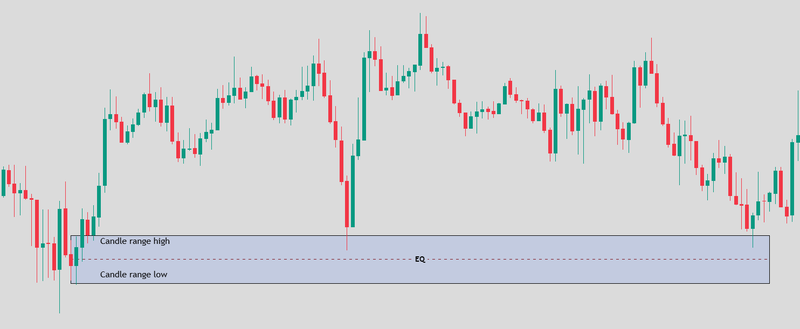
Source: Trading view
Why does Candle Range Theory focus on liquidity?
Candle Range Theory (CRT) suggests that price can swing beyond previous highs and lows, set off orders around those levels and reverse.
Previous highs and lows attract attention because traders can be found placing stop-loss and breakout orders there.
For instance, if the EUR/USD pair fails to break above 1.1000 repeatedly, it may attract a cluster of stop-loss orders placed above by traders in the short trade.
Breakout traders may also place buy-stops orders there. If the 1.1000 level gets broken, some of the orders may get triggered.
While triggering stop orders may give price a one-way move, it doesn’t always guarantee a continuation in that direction. The failure of a break-out may lead to price moving in the opposite direction of the range, thereby, invalidating the previous accumulation.
How does the Power of Three relate to CRT?
The Power of Three (or AMD) model describes the three phases of market activity. In the first phase, price action remains ranging and is deemed to be in an accumulation phase.
Buyers and sellers transact amongst themselves without establishing a clear directional move. In the second phase, also known as Manipulation, price moves outside of the ranging activity.
It may break above a previous resistance level to set off an area of sell-stops and buy-stops which may trigger a failure. In the last phase, also known as Distribution, price moves in the opposite direction of the previous ranging activity and breaks down towards support.
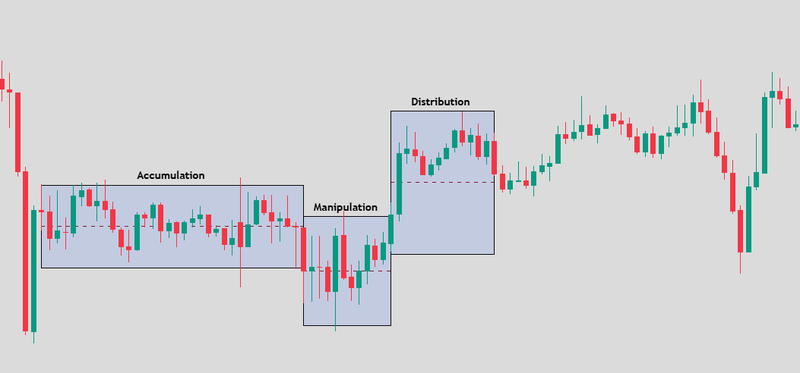
Source: Trading view
How does the three-candle CRT pattern work?
The Three-Candle CRT model starts with the establishment of a trading range by the first candle, the second candle breaks out of that trading range and comes back to close within it, the third candle is expected to run towards the other side of the trading range.
Candle 1: Setting the Range
The first candle of the Three-Candle model illustrates the highs and lows traders will be watching.
Using the EUR/USD again, the first candle of the model could be a four-hour candle that has a high of 1.0900 and a low of 1.0840.
From this example, the CRH becomes 1.0900 and the CRL becomes 1.0840. At this point, there is no confirmed CRT pattern.
Traders are simply labeling the range and waiting to see how the price reacts to the boundaries.
Candle 2: The Liquidity Sweep
The second candle of the pattern breaks out of one of the boundaries of the range and comes back to close within the range. For a bullish CRT, the price of the second candle breaks out of the CRL and comes back to close above the CRL.
For a bearish CRT, the price of the second candle breaks out of the CRH and comes back to close below the CRH. For the EUR/USD example, let’s say the second candle comes down to test the low at 1.0840 and breaks below it.
After the break, buyers come in and push the price up to 1.0860 where the second candle of the model closes.
The second candle has swept the previous low of 1.0840 and closed back within the range. For a bearish rejection to be confirmed, the second candle could have closed below 1.0840. Price could be establishing a breakout below the range rather than rejecting it.
Candle 3: The Expansion
The third candle in the model is expected to move in the direction of the breakout. Price already swept the range low and is inside the range, in the bullish EUR/USD example.
Traders could look for a move up towards the range equilibrium at 1.0870 and possibly the range high at 1.0900.
The bearish example works in reverse. After price swept above the CRH and closed back inside the range, traders would look for a move towards the midpoint and eventually the CRL.
Price could reverse and retest the swept level, break through the level or consolidate in a sideways range. Some CRT setups can also take longer than 3 candles to complete.
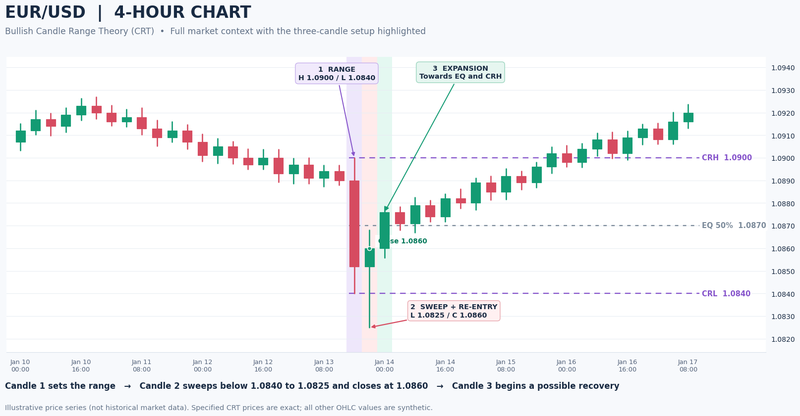
Source: ChatGPT- authors idea
How can traders use multiple timeframes with CRT?
Traders can use a higher timeframe to identify the candle range and a lower timeframe to look for an entry after the liquidity sweep.
For example, the four-hour chart may show a potential bullish CRT developing near an important support area.
A trader can then move to the 15-minute or five-minute chart to examine how price behaves after breaking the four-hour candle's low. This provides more detail about the reversal without changing the original range boundaries.
Why are higher-timeframe levels important?
CRT setups may be more relevant when they occur around significant areas of support or resistance.
These can include previous daily highs and lows, Fair Value Gaps (FVGs) and order blocks.
For example, suppose gold approaches a previous daily low that also overlaps with a bullish order block.
If price briefly trades below that low and subsequently closes back inside the reference candle's range, traders may consider the possibility of a bullish CRT.
The higher-timeframe level provides additional context for why buyers could respond around that area.
Which trading sessions are important for CRT?
The Asian, London and New York sessions can provide important context as there can be differences in trading activity and volatility.
The Asian session can create a narrow trading range. If the breakout beyond the range fails, traders may look for a reversal in London trading, and if that fails, look for a reversal in the New York trading session.
For example, EUR/USD may establish a range between 1.0850 and 1.0880 during Asia. During London, price moves below 1.0850 but returns inside the range.
A trader may then watch whether price begins moving towards 1.0880, particularly if the lower-timeframe market structure turns bullish.
What are the risks of Candle Range Theory?
The key risk here is thinking that a liquidity sweep will always lead to a reversal.
There is also the risk of price breaking beyond the previous candle's high or low and continuing to move in the same direction.
Even if a candle closes back inside the range, the next candle may fail to reach the target.
Also, candles at lower timeframes may produce frequent sweeps that carry little to no significance in the overall directional move of the market.
Another error is using CRT to random candles with no regard to the prevailing trend in the market.
Trading at the time of a significant economic release can be also very risky, due to the large and unpredictable price moves.
FAQs
What does CRT mean in trading?
CRT stands for Candle Range Theory. It is a technical analysis method that uses the high and low of a candlestick to identify potential liquidity sweeps and reversals.
Does Candle Range Theory always use three candles?
No. The classic CRT model uses three candles, but the movement can develop over a longer period. Some variations complete the sweep and reversal within two candles.
What is the 50% level in CRT?
The 50% level is called equilibrium. It is calculated by averaging the candle's high and low and may be used as a potential reaction area or profit target.
What confirms a valid CRT setup?
A common confirmation rule requires price to move beyond the high or low of the reference candle and then close back inside its range. Traders may also look for a lower-timeframe Market Structure Shift.
Which timeframe is best for Candle Range Theory?
CRT can be applied to several timeframes. Traders may identify ranges on the daily or four-hour chart and use the 15-minute or five-minute chart to look for entries. No timeframe guarantees better results.