Support
Footprint charts explained: how to read order flow and identify trading opportunities
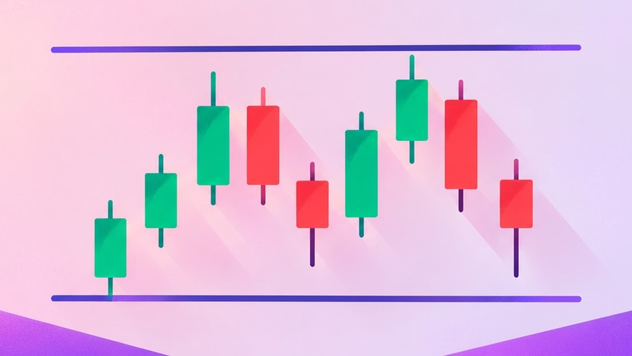
Footprint charts are a type of order-flow chart that shows how buying and selling activity is distributed across individual price levels inside a candle. footprint charts reveal the volume traded at the bid and ask, helping traders assess which side is more aggressive and where orders may be absorbing market pressure.
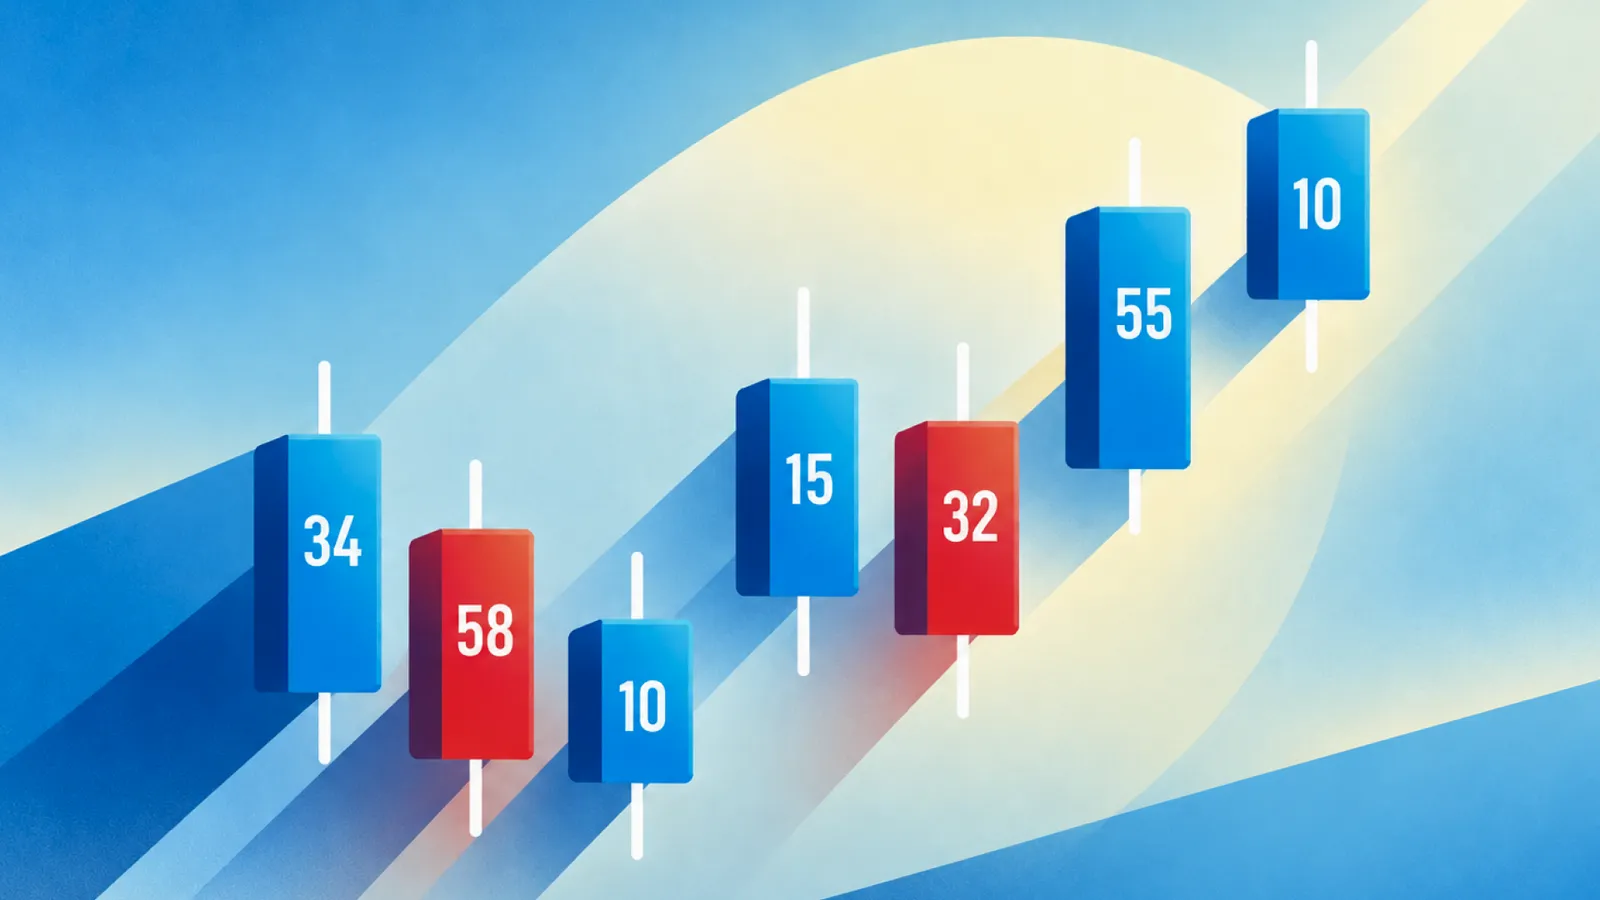
A footprint chart breaks each candle into individual price levels and displays the executed buying and selling volume at each level.
Left column displays volume executed at the bid, while the right column displays volume executed at the ask.
The Value Area is the price range containing a specified proportion of total volume.
What is a footprint chart?
A footprint chart breaks each candle into individual price levels and displays the executed buying and selling volume at each level. This allows traders to examine the activity hidden inside a conventional candlestick.
For example, a bullish candle may close near its high, suggesting that buyers controlled the session. However, the footprint could reveal that aggressive buying weakened near the high or that substantial selling was absorbed before price moved higher. These details can help traders interpret the quality of the move.
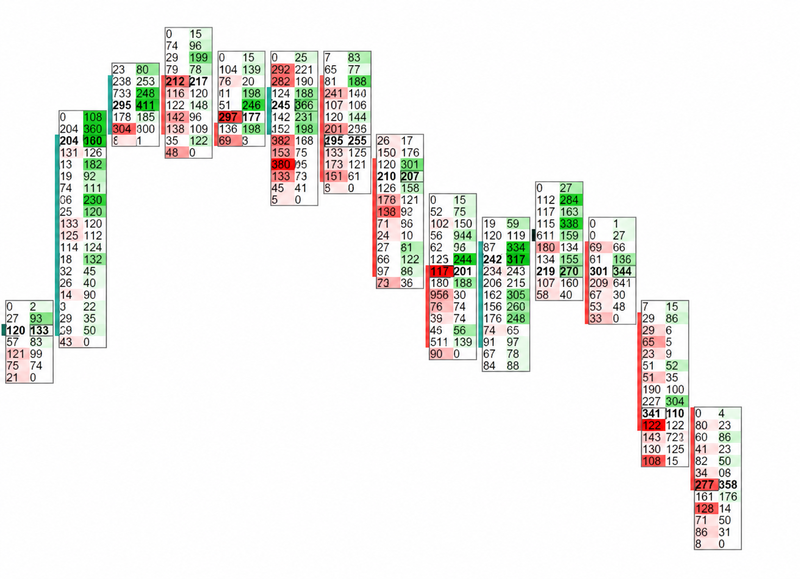
Source: ChatGPT – Authors idea
How to read a footprint chart
The left side vs. the right side
In the common bid × ask footprint format, the left column displays volume executed at the bid, while the right column displays volume executed at the ask.
Bid volume generally represents aggressive sellers hitting resting buy orders. Ask volume generally represents aggressive buyers lifting resting sell orders.
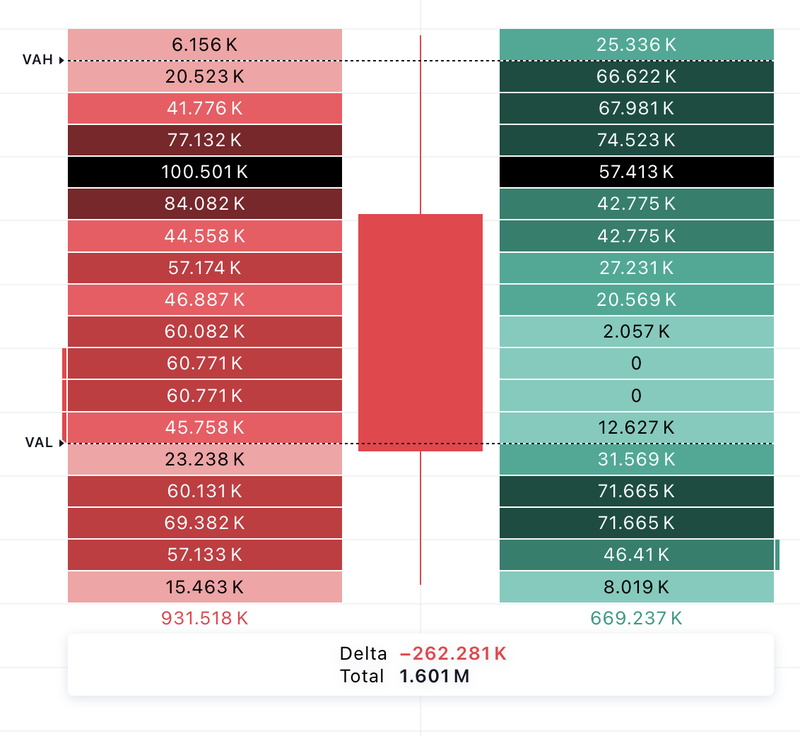
Source: Trading view
The diagonal auction
Many footprint platforms calculate buying and selling imbalances by comparing volumes diagonally across adjacent price levels. For example, ask volume at one price may be compared with bid volume one tick below it.
This comparison helps identify whether aggressive buying or selling is unusually concentrated relative to the opposing side at neighboring prices.
Colour gradients
Footprint platforms often use colour intensity or shading to highlight areas of high volume, strong buying or selling, and significant imbalances. Darker or more prominent colours may indicate greater activity relative to a selected threshold.
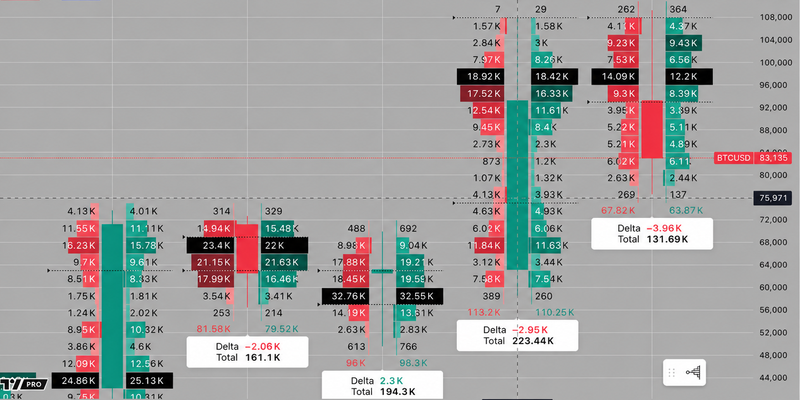
Source: Trading view
Key concepts in footprint trading
Volume
Volume measures the number of contracts, shares or other units traded at a particular price level during a selected period. High volume indicates substantial trading activity, but it does not automatically mean that buyers or sellers are winning.
The market's reaction is equally important
Heavy volume with continued upward movement may indicate that buyers are successfully pushing price higher. Heavy volume with little upward progress may suggest that substantial selling is absorbing the buying pressure.
Delta
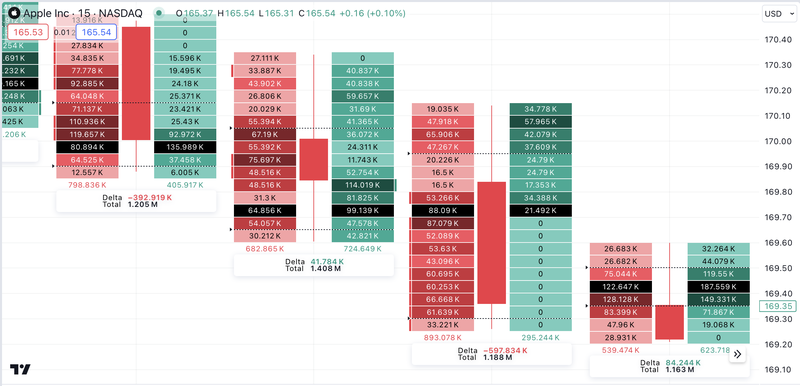
Delta measures the difference between aggressive buying volume and aggressive selling volume.
Delta = Ask Volume − Bid Volume
A positive delta means more volume traded at the ask than at the bid, indicating greater aggressive buying. A negative delta means more volume traded at the bid, indicating greater aggressive selling.
For example, if a candle records 800 contracts at the ask and 500 at the bid, its delta is positive 300 contracts.
Source: Trading view
Point of Control (POC)
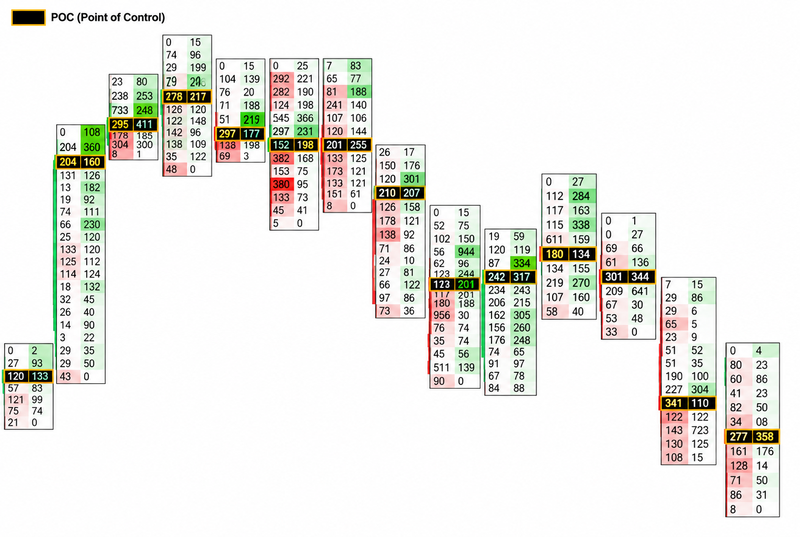
The Point of Control is the price level within a candle or selected profile where the greatest volume was traded. On a footprint chart, it is often highlighted to make the highest-volume price easy to identify.
The POC can help traders locate where the most trading activity occurred within the candle. If price repeatedly accepts a level with high volume, it may indicate an area of agreement between buyers and sellers.
If price moves rapidly away from a high-volume area, it may suggest that the market is seeking prices where the balance between buyers and sellers differs.
Source: Trading view
Value Area (VA)
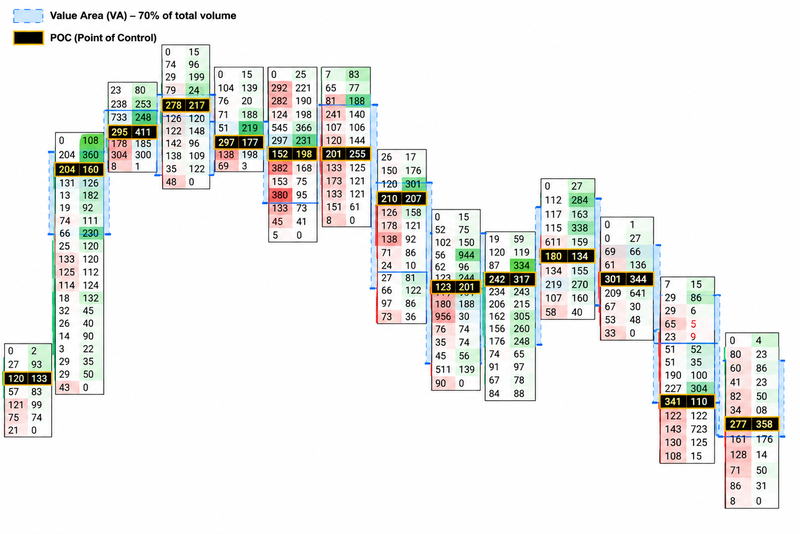
The Value Area is the price range containing a specified proportion of total volume, commonly around 70% in volume-profile tools. It identifies the range in which most trading activity occurred.
Some platforms apply value-area calculations to individual candles or selected profiles, while others use session or composite profiles. Traders should check which range the platform is measuring.
Price remaining inside a value area may indicate continued acceptance of that range. A move outside it, particularly when accompanied by strong directional volume, can suggest a potential shift in market conditions.
Source: Trading view
Key footprint trading patterns
Buying and selling imbalances
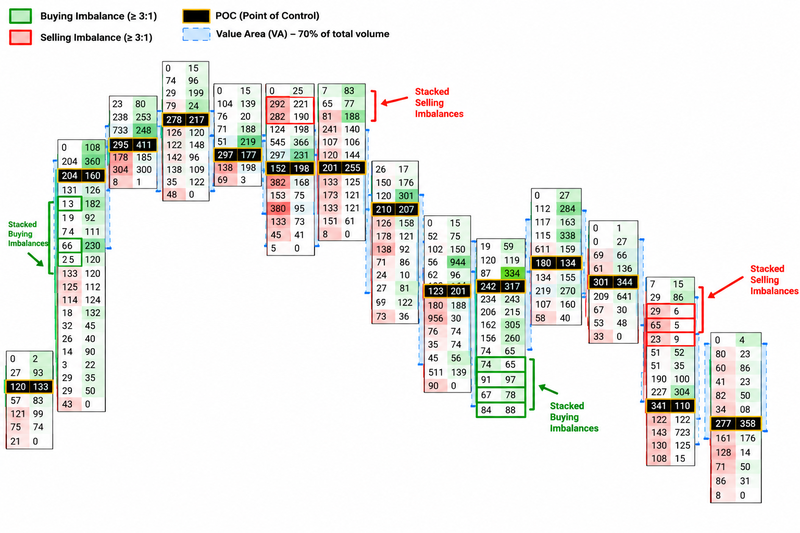
A buying imbalance occurs when aggressive buying volume at one price is significantly greater than the corresponding selling volume used in the platform's comparison. A selling imbalance occurs when aggressive selling dominates the opposing volume.
Some traders use a ratio of 3:1 or greater as a starting threshold, although the appropriate setting depends on the instrument, timeframe and market conditions.
When several buying imbalances appear consecutively across adjacent price levels, they are often called stacked buying imbalances. Stacked selling imbalances describe the opposite pattern.
Stacked imbalances can support a breakout interpretation when price moves beyond resistance or support and continues in the same direction. However, imbalances can also appear near exhaustion points, where aggressive traders enter too late and encounter substantial opposing liquidity.
Source: Trading view
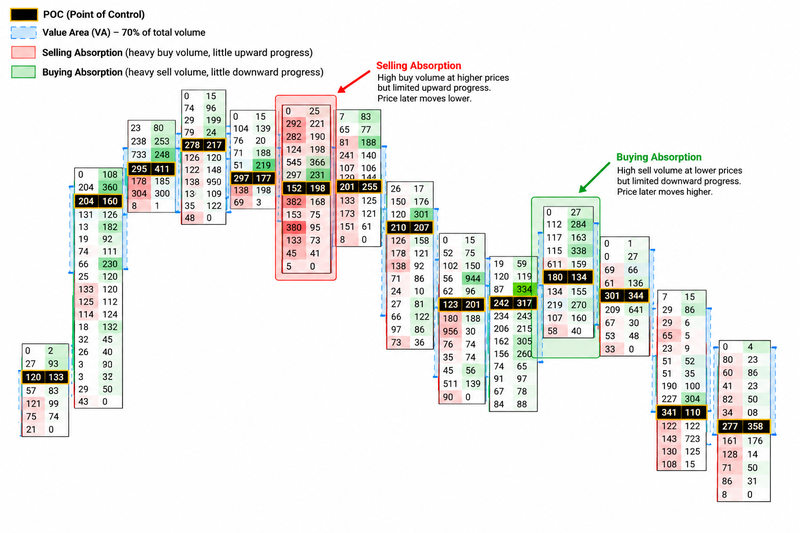
Absorption
Absorption occurs when aggressive buying or selling meets substantial passive limit-order liquidity, preventing prices from progressing as expected.
Imagine price approaching resistance while aggressive buyers repeatedly lift the ask. Volume increases, but prices struggle to move higher. This may indicate that passive sellers are absorbing the buying pressure.
If price subsequently rejects resistance and moves lower, the absorption may have contributed to the reversal. Conversely, if the aggressive buying eventually overwhelms the available sellers, price may break through resistance instead.
The important signal is the relationship between effort and result. Heavy volume with little price progress can indicate absorption, but it must be interpreted alongside the level's location and what price does next.
Source: Trading view
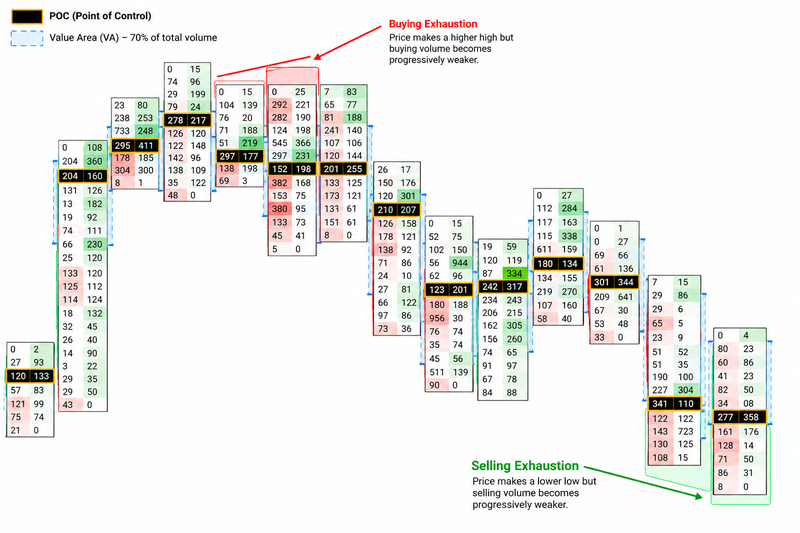
Exhaustion
Exhaustion refers to a decline in aggressive buying or selling activity near a potential turning point. For example, a market may reach a new high while buying volume becomes progressively weaker, suggesting that fewer buyers are willing to continue lifting prices.
A similar pattern can develop near a low when aggressive selling diminishes
Exhaustion is not the same as absorption. Absorption involves aggressive orders meeting opposing liquidity, while exhaustion refers to the weakening of aggressive participation. Either can precede a reversal, but neither guarantees one.
Source: Trading view
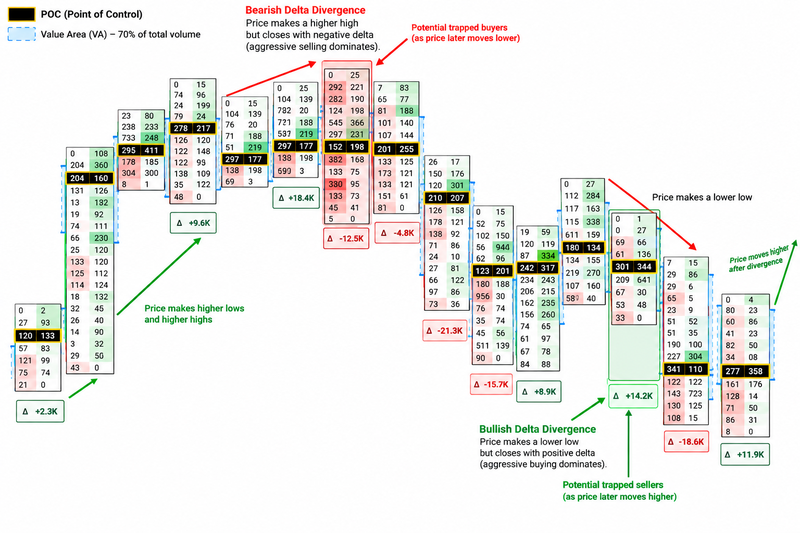
Trapped traders and delta divergence
Delta divergence occurs when price movement and delta appear to contradict one another. For example, a candle may close higher despite recording negative delta, meaning aggressive selling dominated the executed volume even though price finished above its opening level.
This can suggest that aggressive sellers were unable to push prices lower, potentially because passive buyers absorbed their selling. If price subsequently rises, those sellers may be forced to cover their positions, adding buying pressure.
The opposite can occur when price closes lower despite positive delta, suggesting that aggressive buyers fail to sustain upward progress.
These conditions can help traders identify potentially trapped participants, but the candle alone does not prove that traders are trapped. Confirmation from subsequent price action is important.
Source: ChatGPT – Authors idea
How to use footprint charts in a trading strategy
Start by identifying a relevant technical level, such as previous support or resistance, a swing high or low, or a liquidity zone. Then observe the order flow as price approaches that area.
If price breaks above resistance, stacked buying imbalances and continued upward progress may support the breakout.
If aggressive buying increases but price fails to advance, absorption may be developing instead. A subsequent rejection and bearish shift in price structure could support a different interpretation.
The same logic applies below support
Strong selling pressure accompanied by continued downward movement can support a bearish breakout, while heavy selling with limited downside progress may indicate that passive buyers are absorbing the flow.
Traders can use a lower timeframe for entry analysis while keeping higher timeframe direction and key price levels in view. Footprint data should refine the trade thesis rather than replace it.
Risks of footprint trading
The main risk is interpreting order-flow signals in isolation. Positive delta can appear during a market decline, and negative delta can appear during a rally. These readings reflect how trades were executed, not a guarantee of future direction.
Footprint data can also be misleading when volume is incomplete, trade classification differs across platforms or settings are poorly calibrated. This is particularly relevant in decentralized markets such as spot forex, where a platform may not capture all market activity.
Another risk is overreacting to imbalances
A large imbalance can signal aggressive participation, but the move may already be extended or approaching a level where opposing liquidity is concentrated.
Finally, footprint charts can encourage excessive short-term trading because they provide a large amount of information. Traders should establish entry conditions, invalidation levels and position sizing before acting on an order-flow signal.
FAQs
What is a footprint chart in trading?
A footprint chart displays executed buying and selling volume at individual price levels within a candle. Traders use it to analyse order flow, identify imbalances and assess how price responds to trading activity.
How do you read a footprint chart?
In a common bid × ask footprint, the left column shows volume executed at the bid and the right column shows volume executed at the ask. Traders compare these figures with price movement to identify aggressive buying, aggressive selling and potential absorption.
What is delta in footprint trading?
Delta is the difference between ask volume and bid volume. Positive delta indicates more aggressive buying volume, while negative delta indicates more aggressive selling volume.
What is the Point of Control (POC) on a footprint chart?
The Point of Control is the price level where the highest volume was traded within the selected candle or profile. It helps traders identify where trading activity was most concentrated.