Inducement in SMC explained: how smart money traps work
Inducement is one of the most important ideas in Smart Money Concepts and ICT-style trading. It describes a market move that appears to invite traders into the wrong side of the market before price reverses toward the real liquidity target.

Inducement, often shortened to IDM or IND, is a move that attracts traders before price reverses.
A liquidity grab takes stops, while inducement often happens before that stop-taking move.
It often appears near obvious highs, lows, support, resistance, BOS, or CHOCH areas.
What is inducement in trading?
Inducement in trading is a price move that encourages traders to enter before the market moves against them.
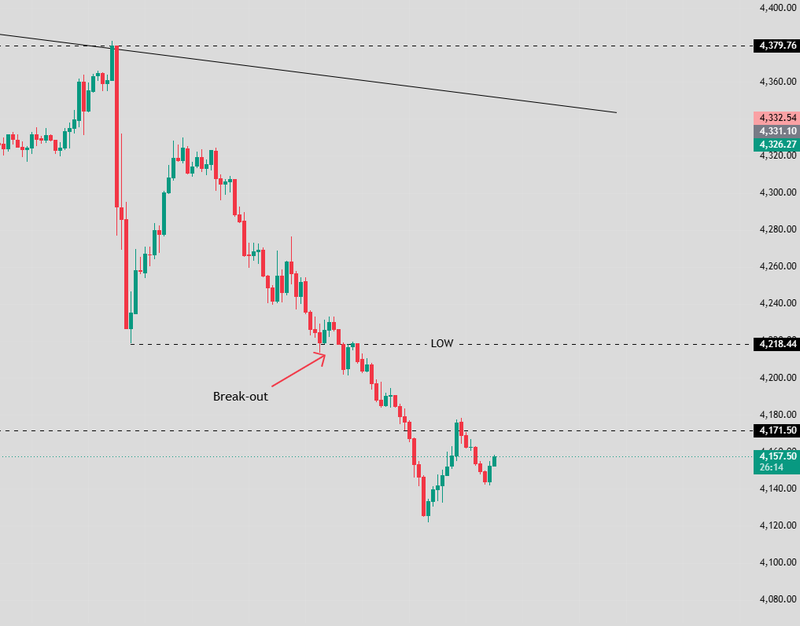
It usually happens around levels that look obvious. For example, price may break a small high and make traders think a bullish continuation has started. Buyers enter, stops are placed below the breakout area, and then price reverses lower. In that case, the breakout acted as inducement. It attracted buyers before the market moved toward their stop-loss orders.
The same can happen in the opposite direction. Price may break a small low, encourage sellers to enter, then reverse higher and take their stops. The move lower was not the real continuation. It was the trap before the stronger move.
In Smart Money Concepts, inducement is important because it helps explain why price often moves beyond obvious levels before turning. The market does not always move in a clean straight line. It often creates a reason for traders to enter, gathers liquidity, and then moves toward the real target.
Source: Trading view
Inducement vs liquidity grab vs stop hunt
Inducement, liquidity grab, and stop hunt are related ideas, but they are not the same.
Inducement is the setup that attracts traders into the market. It is the move that makes a trade look obvious. A liquidity grab is the move that takes liquidity from obvious stop areas. A stop hunt is a broader term traders use when price moves into stop-loss zones before reversing.
The easiest way to separate them is to think in sequence. Inducement often comes first. Traders are invited into a position. Their stops then create liquidity. After that, price may move toward those stops and trigger a liquidity grab.
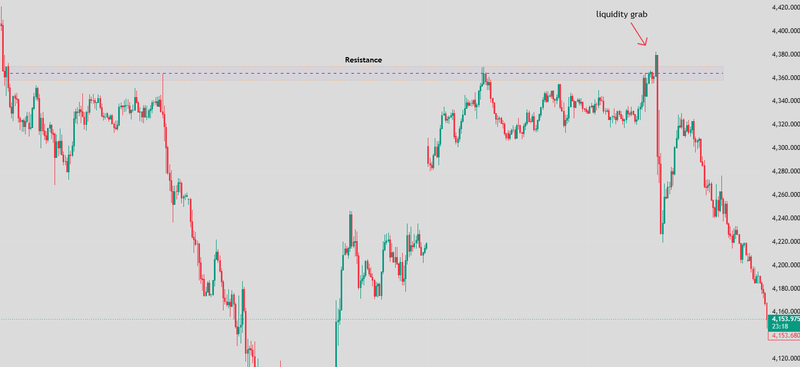
For example, imagine price breaks above a small resistance level. Buyers enter because the breakout looks strong. Their stops are likely below the breakout or below the recent low. If price then reverses and pushes into those stops, the first breakout was inducement, and the move into the stops was the liquidity grab.
Source: Trading view
Why inducement happens in SMC and ICT
Inducement happens in SMC and ICT because these approaches view price as a search for liquidity.
In this framework, the market often moves toward areas where orders are likely to be resting. These areas include equal highs, equal lows, recent swing points, breakout zones, and obvious support or resistance levels. Retail traders tend to place stops around these areas because they are easy to see.
Inducement forms when price creates a setup that looks attractive enough to pull traders in. Once traders enter, their stop-loss orders become part of the liquidity map. Price may then move against them to collect that liquidity before continuing in the real direction.
This does not mean every move is manipulation or that every breakout is fake. Markets move because of order flow, positioning, and liquidity. Inducement is simply one way traders describe the process of price attracting weaker positioning before a cleaner move develops.
That is why context matters. Inducement is more meaningful when it appears near a key liquidity pool, after a structural shift, or before a move into a higher-timeframe level.
Common inducement scenarios and types
Inducement can appear in several forms, but the logic is usually the same. Price creates a level that looks tradable, attracts traders, then moves against them.
One common scenario is inducement above a short-term high before a bearish move. Price breaks the high, buyers enter, then the market reverses lower. Another scenario is inducement below a short-term low before a bullish move. Price breaks the low, sellers enter, then the market reverses higher.
Inducement can also appear as a clean trendline break, a fake continuation candle, or a small pullback that looks like a safe entry. The common feature is that the trade looks too obvious before the real move begins.
This is why traders should not only ask whether a level has broken. They should ask where price is breaking, who is likely entering there, and where their stops are likely placed.
In many cases, inducement becomes clear only after the market reacts. That is normal. The aim is not to predict every trap perfectly. The aim is to avoid being the trader who enters too early into the trap.
Inducement around BOS and CHOCH
Inducement often appears around BOS and CHOCH because these are areas where traders expect structure to confirm direction.
A BOS, or break of structure, usually suggests that the existing trend is continuing. A CHOCH, or change of character, usually suggests that market behaviour may be shifting. Because these signals are widely watched, they can attract traders quickly.
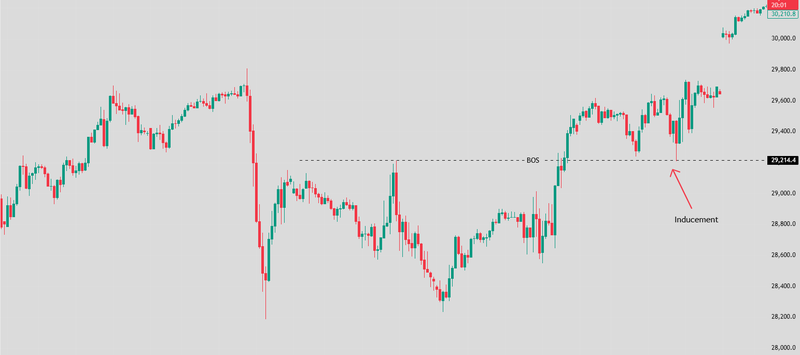
The problem is that not every structural break is clean. Sometimes price creates a small BOS to encourage traders to enter, then reverses and attacks the liquidity behind the move. Other times, price forms what looks like a CHOCH, pulls traders into a reversal idea, then returns to the original trend.
This is where inducement becomes important. A trader who enters immediately after every BOS or CHOCH may be reacting too early. The market may still need to take liquidity, rebalance price, or return to a stronger point of interest before the better setup appears.
A more patient approach is to wait for confirmation after the break. That could mean a clean displacement candle, a retest that holds, a fair value gap reaction, or a failure of price to return inside the old range.
Source: Trading view
Bullish vs bearish inducement
Bullish inducement happens when price encourages traders to sell before reversing higher.
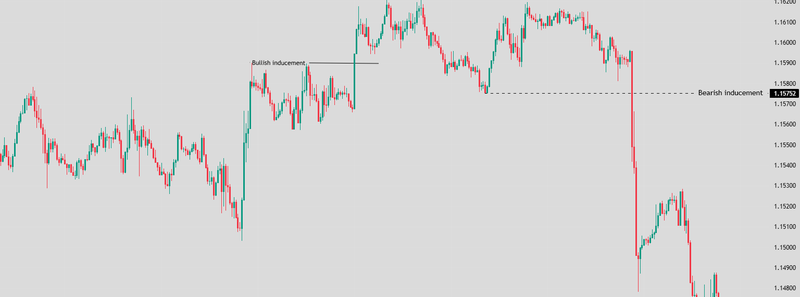
This often appears when price breaks below a short-term low, support level, or sell-side liquidity area. Sellers enter because the breakdown looks real. Their stops usually sit above the recent swing high or above the broken level. If price then rejects the low and moves higher, those sellers become trapped. In that case, the move lower acted as inducement before the bullish move.
Bearish inducement works in the opposite way. Price breaks above a short-term high or resistance level, encouraging buyers to enter. Their stops usually sit below the breakout area or below the recent low. If price then fails to hold above the level and reverses lower, the breakout may have been inducement before a bearish move.
Source: Trading view
How to identify inducement on the chart
Identifying inducement starts with asking one question: where are traders likely to be trapped?
The chart often gives clues. Look for obvious highs and lows, equal highs and equal lows, clean support and resistance zones, trendlines, and breakout levels. These areas are attractive because many traders see the same thing. If many traders see the same thing, their entries and stops may also cluster in similar areas.
Inducement often appears just before price moves into a more important liquidity pool. For example, price may create a small bullish breakout before reversing lower into a major sell-side liquidity area. The small breakout pulls in buyers, but the real target is below.
Another clue is the quality of the move. If price breaks a level weakly, without strong displacement, and then quickly returns inside the range, the breakout may be inducement. A strong move usually leaves clearer evidence. A weak break often shows hesitation.
Still, inducement should not be forced onto every chart. Not every failed breakout is meaningful. The best inducement setups usually appear in the right location, around clear structure, and near a logical liquidity target.
Key structural clues and retail targets
The clearest inducement often forms around levels that retail traders naturally use.
These include previous swing highs, previous swing lows, equal highs, equal lows, trendline breaks, range highs, range lows, and small breakout structures. These levels matter because they are easy to identify. When a level is easy to identify, it often attracts entries and stop-loss orders.
For example, if price creates a clean resistance level and then breaks above it, breakout buyers may enter. Their stops may sit below the breakout candle or below the range. If price quickly reverses and moves into those stops, that breakout may have been inducement.
The same logic applies to sellers. If price breaks below a clean support level, sellers may enter. Their stops may sit above the broken support or above the recent swing high. If price then reverses higher, those sellers become trapped.
The clue is not just the level itself. It is the behaviour after the level breaks. A true breakout should show acceptance. Inducement often shows rejection.
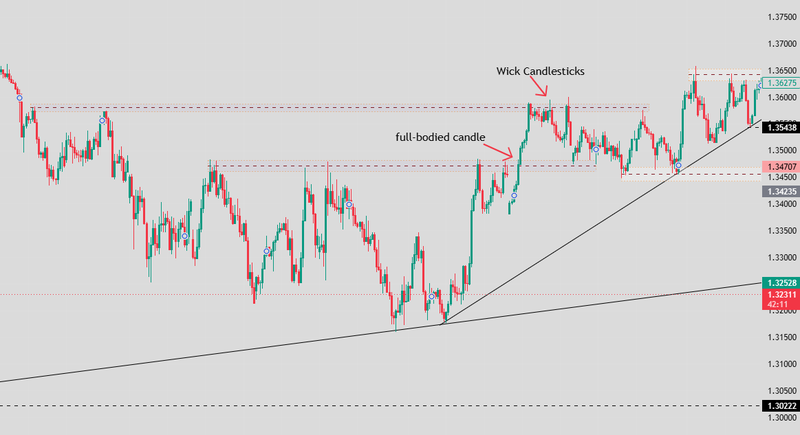
Inducement candlestick signals: wicks vs full-bodied breaks
Candlesticks can help traders judge whether a break is strong or suspicious.
A wick through a level often suggests that price traded beyond the level but failed to hold there. This can be a sign of liquidity being taken. For example, if price wicks above a high and closes back below it, buyers who entered the breakout may already be under pressure. That can support the inducement idea.
A full-bodied break is different. If a candle breaks through a level and closes strongly beyond it, the move may show stronger acceptance. But even then, traders should not assume it is safe. A strong candle can also attract late buyers or sellers, especially if it appears directly into a higher-timeframe liquidity zone.
The key is follow-through. A wick tells you price rejected the level quickly. A full-bodied break tells you price closed beyond the level. But the next candles often reveal the truth. If price fails to continue and returns sharply, the break may still have acted as inducement.
This is why traders should avoid reading one candle alone. The candle matters, but the reaction after the candle often matters more.
Source: Trading view
Step-by-step inducement trade flow
A structured approach helps traders avoid reacting emotionally to inducement.
The first step is to mark the wider market structure. Is price trending higher, trending lower, or ranging? Inducement has more meaning when it appears inside a clear structure. Without structure, every small breakout can look like a trap, which creates confusion.
The second step is to mark liquidity. Where are the obvious highs and lows? Where would breakout traders enter? Where would their stops sit? These areas help create the map.
The third step is to wait for price to create the inducement move. That could be a small breakout, a sweep, a weak structural break, or a candle that pulls traders into the wrong direction.
The final step is confirmation. Traders should not trade inducement just because they suspect a trap. They need evidence that the trap has actually formed. That evidence may come from rejection, displacement, a return inside the range, or a shift in lower-timeframe structure.
Mark the liquidity pool and the inducement level
The liquidity pool is the area where stop orders are likely sitting. The inducement level is the area that attracts traders before price moves toward that liquidity.
For example, suppose price is moving lower and there is an obvious short-term high above the market. Sellers may be watching for a continuation lower, while buy-stop liquidity sits above that high. Price may first move down just enough to encourage new sellers, then reverse higher into the buy stops.
In that case, the small move lower may be inducement. It pulled sellers into the market before price moved in the opposite direction.
To map this clearly, traders can mark recent swing highs and lows, equal highs and lows, and any obvious breakout levels. The goal is not to draw too many lines. The goal is to identify where traders are most likely to react.
Once those areas are marked, price action becomes easier to read. You can see whether the market is moving cleanly or whether it is first creating a trap.
Confirm the trap and plan entry, stop, and targets
Confirmation is what separates a planned trade from a guess.
A trap may be confirmed when price breaks a level, fails to hold, and then moves back in the opposite direction with strength. This can appear as a strong displacement candle, a shift in lower-timeframe structure, or a clean rejection from a point of interest.
After confirmation, the trader can plan the entry, stop, and targets. The entry may come on a retest, a fair value gap reaction, or another structured pullback. The stop is usually placed beyond the invalidation point, not randomly close to entry. The target is often the next liquidity pool or structural level.
This part is important. Inducement is not just about spotting traps. It is about building a trade plan after the trap is confirmed.
If the trade idea is bullish, the trader may target buy-side liquidity above recent highs. If the idea is bearish, the trader may target sell-side liquidity below recent lows. The target should make sense within the broader structure, not just from the inducement signal alone.
How to avoid inducement and common mistakes
The best way to avoid inducement is to stop treating every breakout as confirmation.
Many traders get trapped because they enter the first move. Price breaks a level, the candle looks strong, and they jump in before asking where liquidity is sitting. By the time the market reverses, they realise they bought the high or sold the low.
A better approach is to wait. Let price show whether the breakout is accepted or rejected. If price breaks a level and holds above it, the move may be more reliable. If price breaks and quickly returns inside the range, the breakout may have been inducement.
Another common mistake is ignoring the higher timeframe. A lower-timeframe breakout may look strong, but if it is happening directly into a higher-timeframe liquidity zone, it may be risky. The larger chart often explains why a smaller chart signal fails.
Traders should also avoid seeing inducement everywhere. Not every losing trade was inducement. Sometimes the setup was simply weak, the market changed, or the entry was poorly timed. The concept is useful only when it is applied with structure and evidence.
Chasing breakouts too early
Chasing breakouts too early is one of the easiest ways to get caught by inducement.
The market often knows where breakout traders are likely to enter. A clean level breaks, momentum appears, and traders rush in because they fear missing the move. That emotional entry creates vulnerability. If price reverses, their stops become liquidity.
This is why patience matters. A good trader does not need to catch the first candle. They need to understand whether the breakout is real or whether it is pulling traders into a trap.
One practical method is to wait for acceptance. If price breaks above resistance, does it hold above that level? Does the retest respect it? Does volume or momentum support the move? If the answer is no, the breakout may not be strong enough.
The same applies to downside breaks. If price breaks support but quickly reclaims it, sellers may be trapped. In that case, the better opportunity may come after the failed breakdown, not during the first lower move.
FAQs
What is inducement in SMC?
Inducement in Smart Money Concepts is a price move that encourages traders to enter before the market reverses against them. It often appears around obvious support, resistance, highs, lows, BOS, or CHOCH areas. The goal is usually to attract liquidity before price moves toward the real target.
What does inducement mean in trading?
In trading, inducement means the market creates a setup that looks attractive but is not the real move. For example, price may break above a small high to attract buyers, then reverse lower after those buyers enter. That false sense of confirmation is what makes inducement important.
Is inducement the same as a liquidity grab?
No, inducement and a liquidity grab are related, but they are not the same. Inducement attracts traders into the market, while a liquidity grab usually takes stop-loss orders from traders already positioned. Inducement often happens before the liquidity grab.
How do you identify inducement in SMC?
Inducement is usually found near obvious market levels where retail traders are likely to react. These areas include recent swing highs, swing lows, support, resistance, trendline breaks, minor breakouts, and liquidity zones. A move becomes more suspicious when it looks too clean or too obvious.
What is bullish inducement?
Bullish inducement happens when price encourages traders to sell before moving higher. For example, price may break below a small low, making traders believe a bearish continuation has started. Sellers enter, stops build above the move, and price then reverses upward.
What is bearish inducement?
Bearish inducement happens when price encourages traders to buy before moving lower. For example, price may break above a small high and attract breakout buyers. Once liquidity builds below them, price may reverse lower and move toward their stop-loss area.


