Support
Mean reversion trading strategy: how to trade price reversals
The mean reversion strategy capitalises on the tendency of asset prices to return to their historical average following extreme deviations. By utilising moving averages, Bollinger Bands, or filtering oscillators such as the Relative Strength Index (RSI), traders aim to identify high-probability reversal opportunities while relying on rigorous risk management to mitigate exposure during volatility spikes.

Asset prices tend to revert to their historical averages after experiencing temporary disruptions driven by economic news or shifts in market sentiment.
Simple moving averages smooth baseline price trends, whereas Bollinger Bands incorporate standard deviations to delineate statistical boundary extremes.
Momentum oscillators filter overbought (>70) and oversold (<30) conditions to enhance operational precision, performing with particular efficacy within range-bound markets.
Comprehensive risk management limits capital impairment during volatility expansion through the strict implementation of stop-loss orders and position sizing.
What is the mean reversion trading strategy?
The mean reversion trading strategy is established on the premise that financial asset prices and their returns eventually revert to their historical average following significant deviations caused by transient market disruptions. These temporary imbalances typically stem from incoming fundamental information that impacts asset pricing, generating short-term shifts in market sentiment that can be either bullish or bearish.
What is the simple moving average and how is it computed?
A Simple Moving Average (SMA) is a dynamic calculation that smooths price trend data over a specified lookback period. Lengthening the calculation window increases the smoothing effect across the trend, whereas shortening the period renders the dynamic average more responsive and volatile. The formula is expressed as follows:
- SMA= (P1 + P2 + ... + Pn) / n
Where:
- P: Represents the asset's closing price for a given period.
- n: Represents the total number of selected observation periods.
- SMA: Represents the resulting Simple Moving Average.
For example, to calculate a 5-day simple moving average with consecutive daily closing prices of $108, $112, $109, $107, and $110, the calculation is: ($110 + $108 + $112 + $109 + $107) / 5 = $109.2.
If the price advances to $115 on the subsequent day, the updated calculation drops the oldest data point and incorporates the newest period: ($115 + $110 + $108 + $112 + $109) / 5 = $110.8. Despite the pronounced single-day price increase, the moving average maintains a smoothed representation of the underlying trend.
Notably, moving average calculations can rely on a simple arithmetic average or employ weighted calculations, which assign greater statistical significance to recent price action.
Trading mean reversion strategies
Mean reversion strategies operate on the core assumption that prices will ultimately seek their historical mean after executing an extended, high-variance move away from that baseline.
Reversion to the mean using simple moving averages
This approach identifies market conditions where an asset's price has stretched substantially far from its moving average, aiming to capture the price correction back toward its central mean value.
However, although this behaviour recurs historically across financial markets, a mean reversion is never guaranteed. Executing this strategy against a strong prevailing trend presents elevated risk, as prices can remain extended away from their dynamic average for prolonged periods.
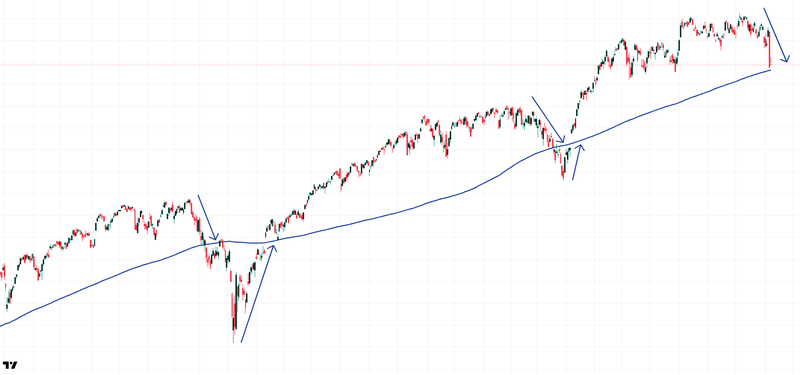
Figure 1. Mean Reversion Strategy using SMA (Example). Source: Own analysis conducted via TradingView.
Mean reversion using Bollinger bands
To address the risks associated with non-reversion or prolonged trend extension, the Bollinger Bands indicator integrates standard deviation bands around a central moving average (which may be simple, exponential, or weighted).
In this framework, traders focus on execution opportunities when the price breaches the outer statistical boundaries of the bands—either the upper or lower threshold. A breach indicates that price movement has exceeded normal deviation parameters, increasing the statistical likelihood of a corrective reaction back toward the central dynamic average.
Nevertheless, prices do not automatically revert following an extreme move; assets can remain attached to an outer band during strong directional momentum. Consequently, robust risk management tools are mandatory to contain losses when market price action opposes the trading position.
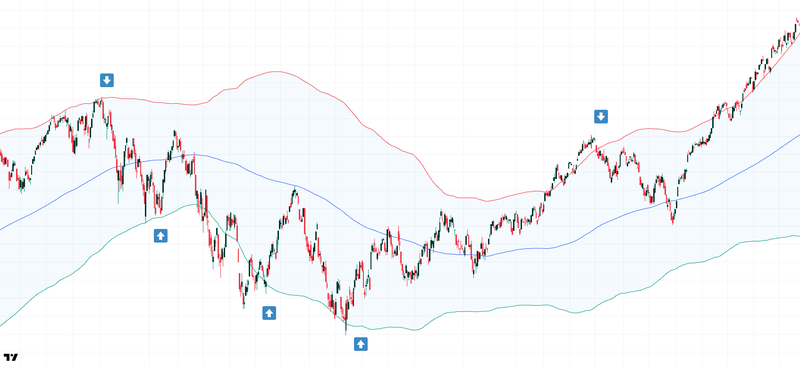
Figure 2. Mean Reversion Strategy using Bollinger Bands (Example). Source: Own analysis conducted via TradingView.
Mean reversion using RSI
Given the risk of sustained price extensions beyond a dynamic average, traders frequently incorporate secondary technical filters to increase trade signal probability. The Relative Strength Index (RSI) is commonly deployed as an operational confirmation filter alongside mean reversion setups.
Under this methodology, a trader only initiates a trade if the RSI indicates extreme reading levels. An RSI reading above the upper boundary (typically set at 70) signals overbought conditions, prompting the trader to seek short entries anticipating a return to the moving average. Conversely, an RSI reading below the lower boundary (typically set at 30) signals oversold conditions, supporting long entries targeting the mean.
This convergence approach demonstrates higher reliability in range-bound or sideways markets, though it can be adapted for trending environments using structural adjustments. Furthermore, while the RSI serves as a primary example, various alternative momentum indicators can fulfil this confirmatory role within a mean reversion framework.
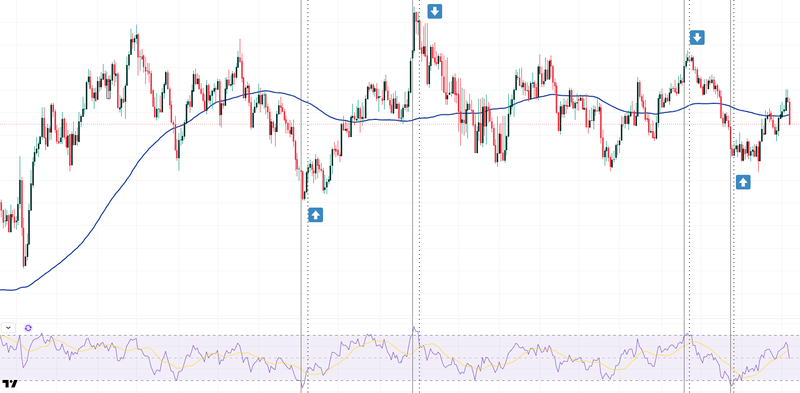
Figure 3. Mean Reversion Strategy using RSI (Example). Source: Own analysis conducted via TradingView.
Risk management in mean reversion trading strategies
Because mean reversion systems are susceptible to false signals, maintaining a structured risk management regime is essential to protect trading capital.
Risk of trading against the trend
Applying mean reversion rules indiscriminately can yield severe drawdown, particularly when taking positions counter to an established trend. Underlying directional momentum can sustain price levels above or below a moving average for extended durations. Therefore, traders must adhere to strict risk parameters to cut losses promptly if the price fails to revert.
Volatility risk and structural breakdowns
When a trader enters a mean reversion trade and the market experiences a sudden volatility expansion, the resulting structural price breakdown can inflict significant capital impairment. These sudden structural shifts are typically driven by major macroeconomic or fundamental catalysts that permanently alter an asset's valuation trajectory.
For instance, if a trader enters a long position expecting a bounce toward an upper mean, but adverse news triggers an aggressive sell-off, losses can compound rapidly as the prior statistical baseline becomes invalid. Managing this exposure requires fixed stop-loss parameters and strict position sizing to preserve capital during high-volatility events.
Conclusion
The mean reversion strategy provides a structured quantitative framework for trading market corrections following extreme price extensions. However, relying exclusively on dynamic moving averages is insufficient; incorporating multi-factor confirmation tools such as Bollinger Bands or the RSI significantly enhances trade entry accuracy. Ultimately, long-term profitability depends not only on identifying reversal signals, but on enforcing disciplined risk management frameworks that safeguard portfolio capital against runaway trends and structural volatility spikes.
If you're interested in trading indices, foreign exchange, or commodities, consider exploring the CFD contracts offered by Equiti Group. Please note that trading leveraged derivatives involves a high level of risk and may not be suitable for all investors.
FAQs
What is the mean reversion strategy and what premise is it based on?
It is a trading strategy predicated on the principle that financial asset prices and their returns eventually return to their historical average after experiencing major price deviations. These extensions are typically driven by transient fundamental developments or short-term shifts in market sentiment. Traders aim to identify these statistical extremes to capitalize on the subsequent price correction back toward the mean.
How do Bollinger Bands help reduce the risk of non-reversal?
Bollinger Bands plot standard deviation thresholds around a central moving average to mark statistical boundary extremes. By monitoring breaches of the upper or lower bands, traders can verify whether price expansion has reached an extreme deviation point, increasing the probability of a mean-reverting reaction while reducing premature entries during minor price fluctuations. However, this does not eliminate the risk of prices "riding" the bands during strong trends.
How does the RSI indicator complement mean reversion strategies?
The RSI acts as an operational filter to confirm overbought (>70) or oversold (<30) conditions. Traders execute mean reversion trades only when the oscillator aligns with these extreme parameters, improving entry precision toward the moving average. This combination is especially effective in range-bound markets and helps filter out false signals generated by relying on moving averages alone.
What are the main risks when applying mean reversion and how to mitigate them?
The primary risks include initiating positions against a strong prevailing trend and exposure to volatility spikes caused by structural market shifts. In both scenarios, prices can continue expanding away from the mean rather than correcting, leading to substantial losses. These risks are mitigated through strict risk management rules, including mandatory stop-loss orders, proper position sizing, and multi-indicator confirmation filters.