Support
 OBV indicator: how it works in trading
On-Balance Volume (OBV) is a volume-based indicator used to assess the strength behind price trends. When used with other technical tools, it can help traders identify breakouts and potential divergence signals.

The OBV indicator is used to track whether volume is supporting price movement, particularly during stronger market moves.
It increases when the current close is higher, decreases when the close is lower and stays the same when the price closes flat.
Price and OBV divergences can point to weakening trend momentum and possible market reversals.
OBV can be combined with MACD, RSI and Fibonacci tools to support confirmation of breakouts and reversals.
What is On-Balance Volume?
The On-Balance Volume (OBV) is a momentum indicator that measures the strength of trading volume relative to the behaviour of the market price.
The indicator seeks to identify trending patterns in the price, provided that these movements are accompanied by significant trading volume. Consequently, the OBV indicator attempts to discern the trading patterns of institutional investors, who tend to leave a distinct operational footprint in the market through large transaction sizes.
How is the OBV calculated?
The OBV indicator is calculated using conditional premises that respond dynamically to the closing market price. If the current market price closes above the previous close, an accumulation of olume in OBV occurs. If the current price closes below the previous close, a corresponding volume decline in the OBV is recorded. If the market price remains unchanged between two trading periods, the OBV remains identical to the previous data point. This underlying logic is expressed through the following conditions:
OBV =
- OBV(t-1) + V(t) --- If C(t) > C(t-1)
- OBV(t-1) - V(t) --- If C(t) < C(t-1)
- OBV(t-1) --- If C(t) = C(t-1)
Where:
- OBV: Cumulative current indicator value
- OBV(t-1): Cumulative indicator value of the previous period
- V(t): Total traded volume of the current session
- C(t): Closing price of the current session
- C(t-1): Closing price of the previous session
On-Balance Volume trading strategies
There are several technical patterns described by the OBV indicator that can identify the confirmation of a trend, a possible price reversal, or the validation of a price breakout.
Trend confirmation strategy
When the price of an asset and the OBV indicator converge in the same direction (whether bullish or bearish), the prevailing trend is considered solid. This is because the trading volume reflects consistent momentum followed closely by its closing prices. A trend characterised by ascending lows and highs alongside an increasing OBV marks a robust uptrend. Conversely, a price pattern showing descending lows and highs accompanied by a downward sloping OBV indicates a trend driven by persistent selling pressure.
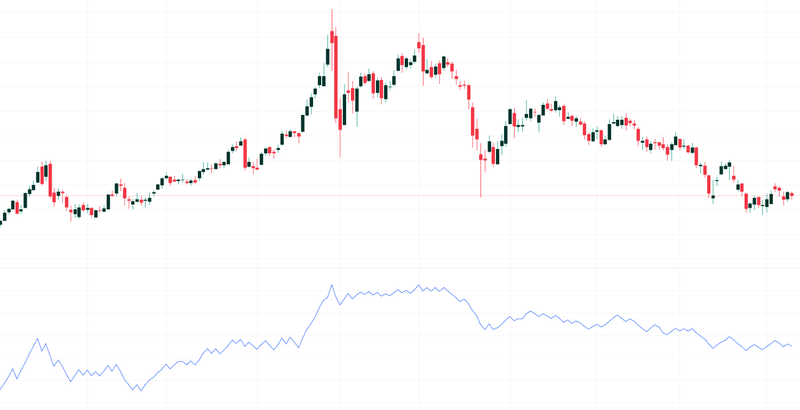
Figure 1. On-Balance Volume (Example). Source: Figure obtained from TradingView.
Divergence strategy
The bullish and bearish divergences indicated by the OBV indicator are critical technical patterns that may signal an underlying shift in volume behaviour, which could subsequently result in a relevant market reversal.
- Bullish Divergence: This occurs when the price of an asset prints lower lows while the OBV forms higher lows; for certain traders, it is sufficient for the OBV to show flat lows to classify the structure as a bullish divergence. Identifying a bullish divergence in the OBV allows market participants to anticipate a likely upward trend reversal following an extended decline (see Figure 2).
- Bearish Divergence: This occurs when the price of an asset prints higher highs while the OBV forms lower highs; for certain traders, it is sufficient for the OBV to display flat highs to be considered a bearish divergence. Identifying a bearish divergence could indicate a likely downward reversal following the formation of the divergence pattern.
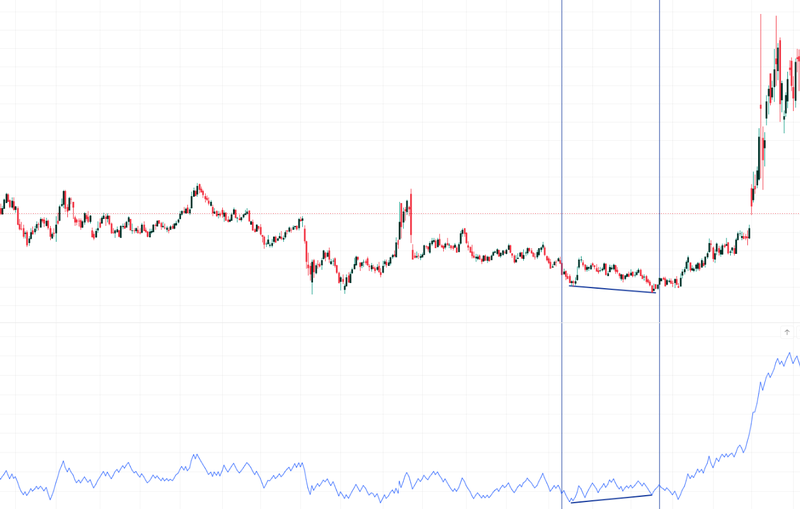
Figure 2. OBV Bullish Divergence (Example). Source: Figure obtained from TradingView.
The analytical importance of divergence formation lies in evaluating how a change in price is failing to be supported by high trading volumes, which are generally associated with the execution of large institutional funds.
Breakout strategy
This phenomenon occurs when the price of an asset has consolidated for a certain period, oscillating within a sideways range, prior to a subsequent breakout of a resistance or support level. If the price breakout is accompanied by a strong, directional expansion in the OBV line, it can be interpreted as a reliable breakout pattern because it is backed by substantial institutional volume.
Example strategies using On-Balance Volume
While the OBV indicator can be integrated with a wide array of technical indicators, the following confluences are widely analysed and deployed because they accurately reflect potential price breakout or reversal movements.
Combination of OBV and MACD
This combination can help identify a reliable breakout following a consolidation process. For example, after a period of sideways price action, if the market price breaks below a key support level, the OBV moves sharply downwards, and the MACD histogram or signal line crosses below the zero line, it can be inferred that the breakout has a high probability of sustained downward continuation.
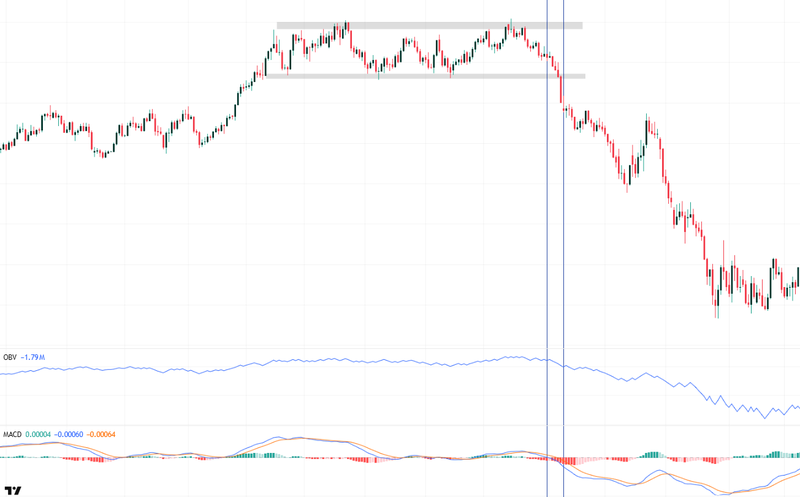
Figure 3. OBV and MACD Confluence (Example). Source: Figure obtained from TradingView.
Combination of OBV and RSI
This confluence may indicate a potential high-probability price reversal. For example, in the case of a bullish reversal, if the market price has exhibited a downward trajectory that pushes the RSI into the oversold zone, a simultaneous bullish divergence on the OBV alongside an RSI cross back above the 30 level suggests a high probability that the price will reverse sharply to the upside.
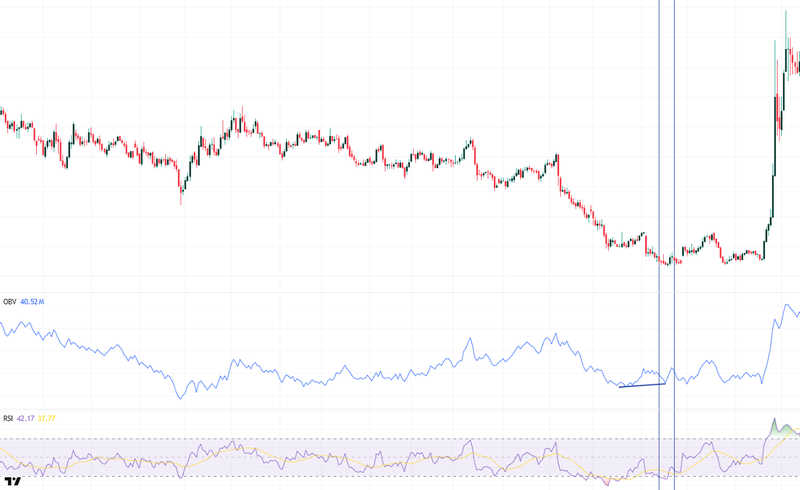
Figure 4. OBV and RSI Confluence (Example). Source: Figure obtained from TradingView.
Combining OBV and Fibonacci Retracements
This combination can indicate areas of price accumulation where institutional traders are revealing levels that they perceive as discounted value. For example, following a retracement process, Fibonacci levels are plotted; if the price reaches a zone of technical interest (such as the 38.2%, 50%, or 61.8% retracements) and the OBV exhibits flat behaviour or a bullish divergence, this indicates that institutional traders are not supporting the downtrend, which in turn points to a possible upward reversal.
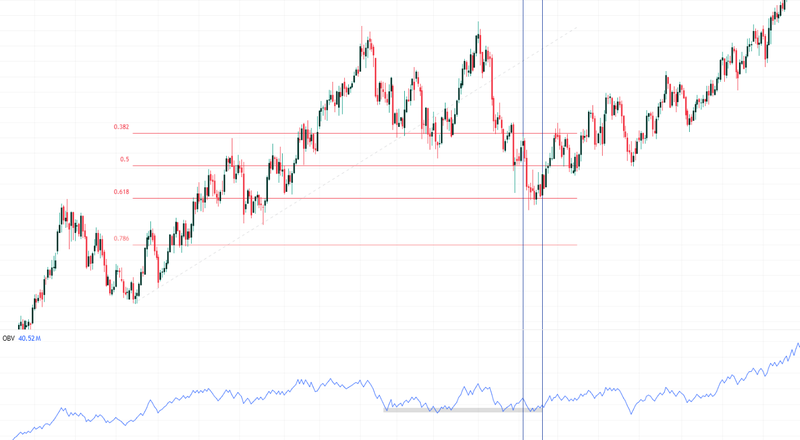
Figure 5. OBV and Fibonacci Retracement Confluence (Example). Source: Figure obtained from TradingView.
Pros and cons of On-Balance Volume
The primary advantage of the On-Balance Volume (OBV) indicator lies in its capacity to capture the intrinsic volume of institutional operations. Consequently, it has demonstrated a high degree of reliability in empirical research documented over time. Furthermore, OBV offers the distinct benefits of straightforward interpretation and a relatively simple calculation method.
Conversely, regarding its disadvantages and limitations, the indicator is highly sensitive to outliers that can distort its cumulative total. An exceptionally high volume in a single period can skew the calculation for subsequent periods, even if this spike does not stem from institutional activity. This distortion typically occurs during phases of heightened market volatility and uncertainty.
Additionally, OBV is primarily reliable when applied to centralised markets. In decentralised markets, calculation discrepancies can arise between financial intermediaries because they reflect localized or private volumes, even when tracking the identical underlying asset.
Conclusion
The On-Balance Volume (OBV) consolidates its position as an indispensable technical tool for validating market structure. By revealing whether price movements are supported by institutional volume, it significantly decreases the risk of trading false breakouts. Furthermore, its structural versatility to integrate seamlessly with momentum oscillators and retracement tools enhances strategic confluences, allowing traders to identify the continuity of solid trends, critical turning points, or asset breakouts with greater certainty.
If you're interested in trading indices, foreign exchange, or commodities, consider exploring the CFD contracts offered by Equiti Group. Please note that trading leveraged derivatives involves a high level of risk and may not be suitable for all investors.
FAQs
What is the On-Balance Volume (OBV) indicator and what is its main objective?
The On-Balance Volume (OBV) is a technical indicator that measures the strength of trading volume in relation to market price movements. Its primary objective is to identify trending patterns when they are backed by significant volume. By doing so, the OBV seeks to track the trading activity of institutional investors, who typically leave traces of their strategies through large transaction amounts, allowing traders to anticipate reliable market movements.
What is a bullish divergence on the OBV and what signal does it offer?
A bullish divergence occurs when the price of an asset registers declining lows while the OBV indicator shows increasing or flat lows. This technical pattern suggests that the prolonged price decline is not supported by actual institutional selling volume. Therefore, it warns of an underlying shift in volume behaviour, allowing traders to anticipate a likely market reversal or upward turn.
How does combining the OBV with the MACD indicator help?
The confluence between the OBV and the MACD is highly effective in confirming the reliability of a breakout following a period of sideways consolidation. For example, if the price breaks above a resistance level, the OBV advances strongly higher (validating institutional interest), and the MACD positively crosses the zero signal line, a high probability is inferred that the upward movement will continue with structural solidity.