Support
SMC trading: how to find trade entries
An SMC entry model is a structured approach to trade execution based on Smart Money Concepts. It uses liquidity sweeps, market structure shifts and price imbalances to help traders find potential entries.
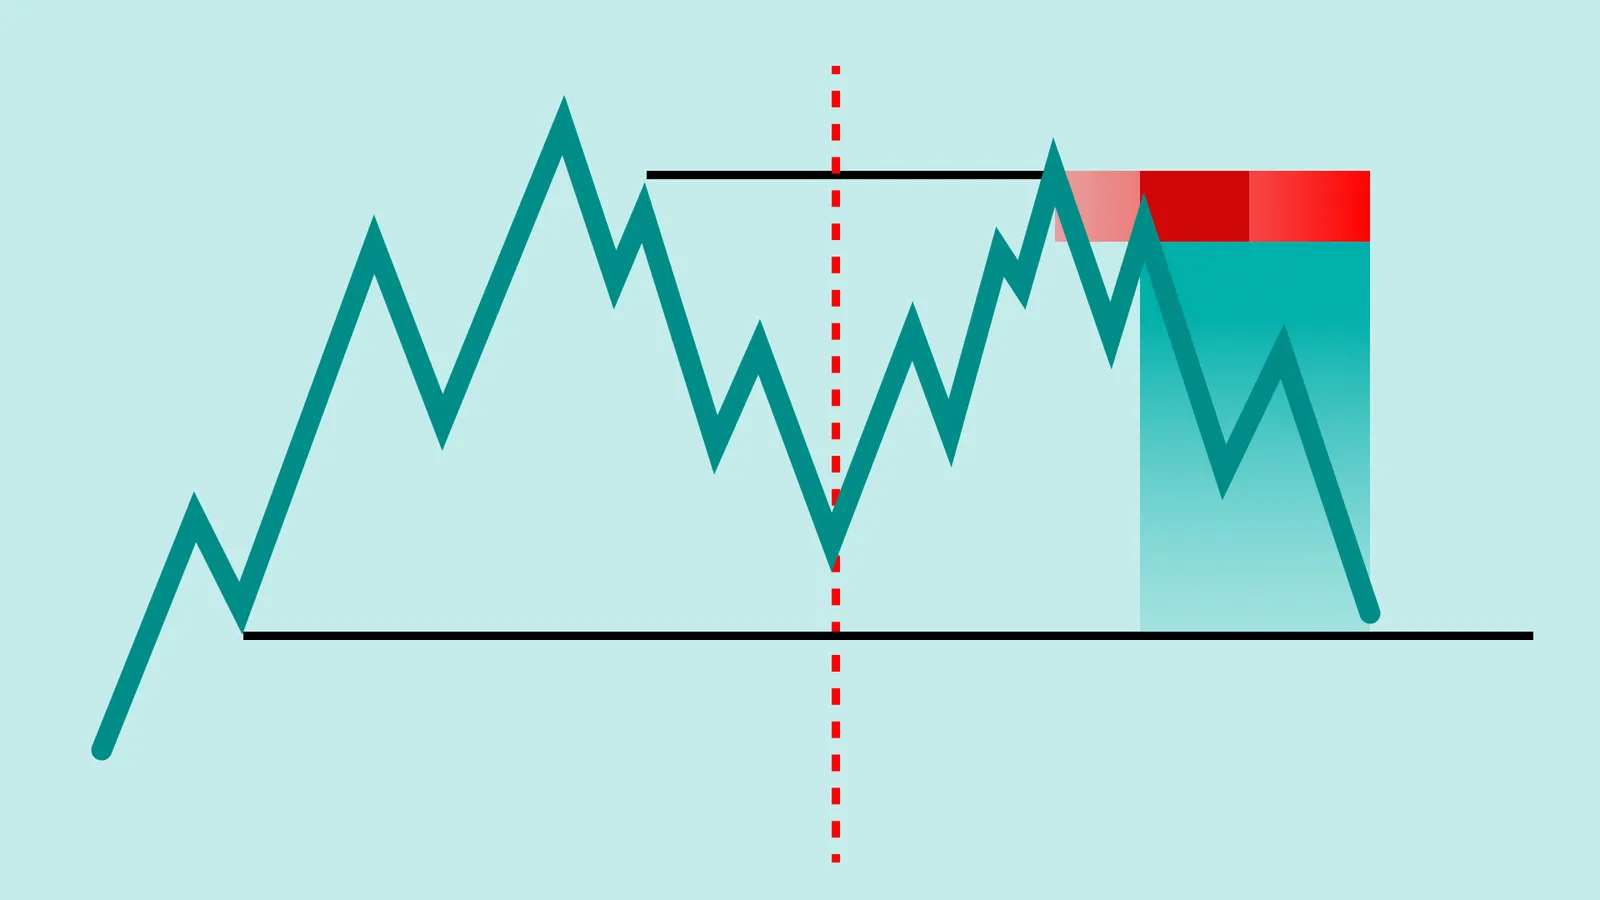
An SMC entry model is a structured trading framework, not a one-off signal to enter.
Higher-timeframe direction comes first, followed by lower-timeframe execution.
Price often seeks liquidity before the true market direction appears.
What is an SMC entry model?
A high-probability trade is usually the result of several pieces of evidence coming together. The higher-timeframe trend should support the trade. Liquidity should be taken first. Market structure should confirm that control has shifted. Only then do traders look for a precise entry using an order block or fair value gap.
Instead of chasing every breakout, SMC traders try to understand the story behind price movement. They ask where liquidity is sitting, why price is moving there, and whether buyers or sellers have taken control before committing to a trade.
Stages of SMC entry model
First, price moves toward liquidity. That liquidity may sit above previous highs, below previous lows, or around other obvious levels where traders have placed stop-loss orders.
Once that liquidity has been taken, the market often reveals its true intention. If buyers or sellers begin taking control, prices start showing signs of a structural shift. Only after that confirmation do traders look for an entry.
Finally, the trade is managed with a predefined stop-loss and a target based on the next area of liquidity. This process helps traders avoid one of the most common mistakes in trading: entering too early.
A liquidity sweep is not automatically a buy or sell signal. An order block is not automatically support or resistance. A fair value gap is not guaranteed to hold. The strength of an SMC entry model comes from combining these ideas instead of treating each one as a standalone strategy.
Core components of an SMC entry model
Before looking for entries on lower timeframes, traders need to understand what the larger market is doing. A strong setup on the five-minute chart can easily fail if it is trading directly against the daily trend.
That is why SMC traders begin with higher timeframes
The daily and four-hour charts usually define the overall trend. Is the market making higher highs and higher lows, or is it making lower highs and lower lows? That answer shapes every decision that follows.
The one-hour chart is then used to narrow the focus. Instead of searching the entire chart for opportunities, traders look for areas where price is likely to react, such as higher-timeframe order blocks, discount zones, premium zones, or major liquidity levels.
Identify liquidity before entering
Once the overall direction is clear, the next step is identifying liquidity. Liquidity is simply an area where many orders are likely to be waiting. Those orders often come from retail traders placing stop-losses or breakout entries around obvious chart levels.
Buy-side liquidity usually builds above previous highs, equal highs, and well-defined resistance levels. Sell-side liquidity usually builds below previous lows, equal lows, and obvious support. These areas matter because they attract orders.
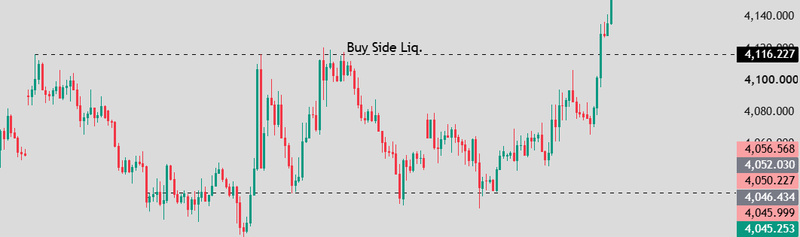
Source: Trading view
Wait for the liquidity sweep
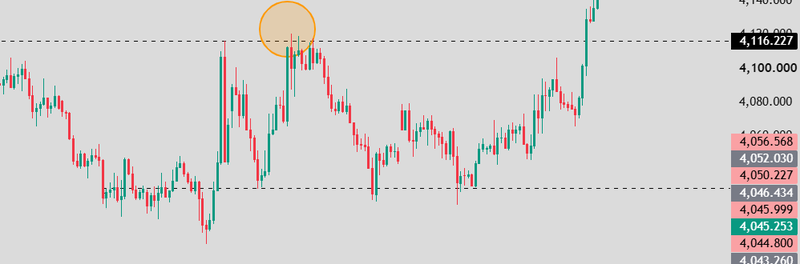
Finding liquidity is only the beginning. The next step is waiting for price to reach it. A liquidity sweep happens when price briefly trades beyond an obvious high or low, triggering stop-losses and breakout orders before reversing. Suppose the higher timeframe is bullish and price approaches yesterday's low.
Many long positions have their stops just below that level. Breakout sellers are also waiting for price to break lower. Once price moves below the low, both groups become active. If buyers immediately regain control and push price back above the low, the market has completed a liquidity sweep.
The same logic applies in reverse during bearish setups. Price trades above an obvious high. Short sellers are forced out. Breakout buyers enter. If sellers quickly regain control, the breakout fails and the market begins moving lower. This is why experienced SMC traders rarely enter before the sweep.
Source: Trading view
Look for a market structure shift
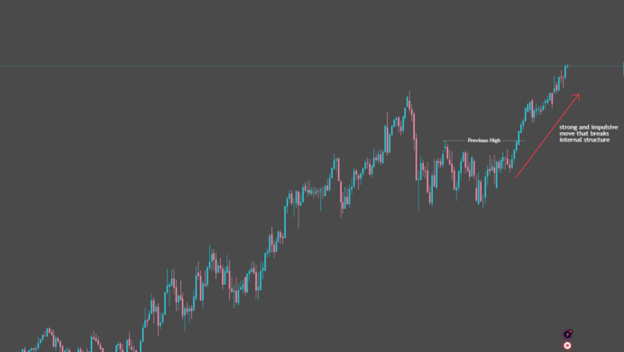
A liquidity sweep tells you where the market has been. Market structure tells you where it may be going next. This is confirmation that many beginners skip. They see price sweep a previous low and buy immediately.
The problem is that a sweep alone does not prove buyers have taken control. Sometimes prices continue to fall after taking liquidity. That is why traders wait for structure to change.
In a bullish setup, confirmation usually comes when price breaks the most recent lower high. This signals that sellers are no longer controlling the short-term trend. In a bearish setup, confirmation appears when price breaks below the most recent higher low, showing that buyers have lost control.
Source: Trading view
Liquidity sweep and fair value gap entry
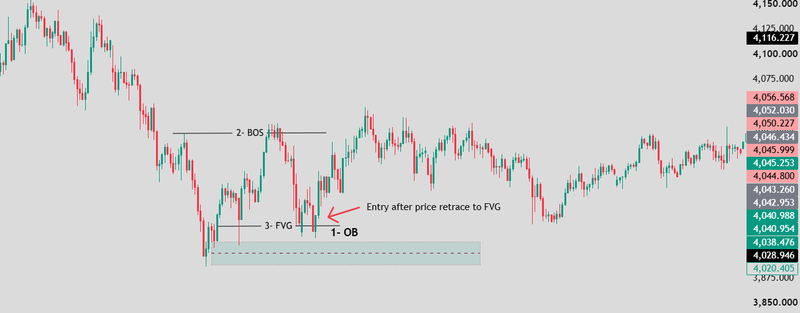
This is the most popular SMC entry because it follows the market's natural sequence. Price first sweeps liquidity above or below an obvious level, trapping breakout traders and triggering stop-loss orders. Once liquidity has been collected, the market shifts structure and moves aggressively in the opposite direction.
That impulsive move often leaves behind a fair value gap. Instead of chasing the move, traders wait for price to retrace into the imbalance before looking for confirmation to enter.
This model works well because it combines three important ideas: liquidity has already been taken, market structure has changed, and the retracement offers a better reward-to-risk ratio than entering immediately after the breakout.
Source: Trading view
Order block entry model
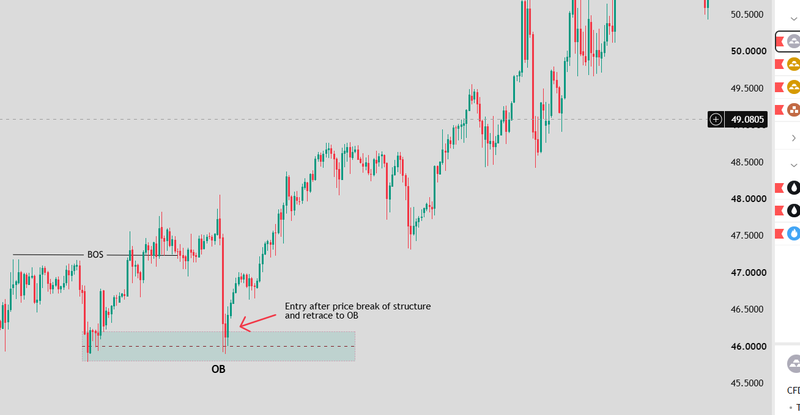
An order block entry is built around the origin of a strong institutional move. After price sweeps liquidity and breaks market structure, traders identify the last opposing candle before the impulsive move. Rather than buying or selling immediately, they wait for price to revisit that area.
The logic is simple. If institutions were willing to enter significant positions from that level once, they may defend it again if price returns. The strongest order block entries usually appear when they align with the higher-timeframe trend and follow a clear displacement move. An order block without liquidity or confirmation is simply another support or resistance zone.
Source: Trading view
Breaker block entry model
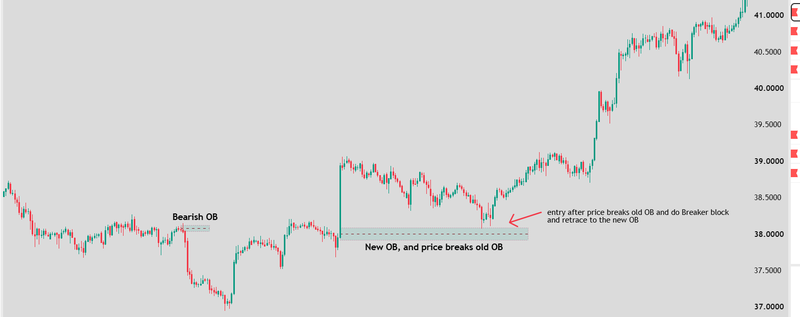
Breaker block is different because it begins with failure. An order block that once acted as support or resistance eventually breaks. When market structure changes, that failed order block often switches roles and becomes a new reaction zone.
For example, a bullish order block may initially hold and send price higher. If buyers later lose control and price breaks below that level, the same zone can become resistance when price returns.
Traders use breaker blocks to trade reversals rather than continuations. The setup becomes stronger when the failure follows a liquidity sweep and is confirmed by a clear break in market structure.
Source: Trading view
Which SMC entry model is best?
The liquidity sweep and fair value gap model is often the easiest for beginners because it follows a clear sequence and provides obvious confirmation.
The order block model works well in established trends where traders want to join the market after a pullback rather than chase momentum.
Breaker blocks are more advanced because they require traders to recognise when the original market narrative has failed. They often appear around major reversals and can offer excellent opportunities when combined with higher-timeframe analysis.
Risks of using an SMC entry model
One of the biggest risks is entering before the setup is complete. Traders often see a liquidity sweep or an order block and assume the market is about to reverse. Without confirmation from market structure and displacement, the move can easily continue against the trade.
Another challenge is relying too heavily on lower timeframes. A perfect-looking setup on the five-minute chart may fail because the higher-timeframe trend is moving in the opposite direction. That is why experienced SMC traders start with the daily or four-hour chart before looking for entries on lower timeframes.
False liquidity sweeps are another common problem. Not every sweep leads to a reversal. Sometimes the market collects liquidity and continues in the same direction. Waiting for a break of structure or a change of character helps reduce this risk, but it cannot eliminate it completely.
Market volatility also plays a role. High-impact economic releases, central bank decisions, and unexpected geopolitical events can invalidate even the strongest technical setup. During these periods, price may ignore order blocks, fair value gaps, and other SMC concepts as volatility increases sharply.
FAQs
What is an SMC entry model?
An SMC entry model is a structured approach to finding trade entries using Smart Money Concepts. Instead of relying on a single indicator, it combines higher-timeframe bias, liquidity, market structure, displacement, order blocks, and fair value gaps to identify high-probability trading opportunities.
What is the best SMC entry model?
There is no single "best" SMC entry model because different market conditions require different approaches. Many traders prefer the liquidity sweep and fair value gap model because it combines liquidity, confirmation, and precise entries. The best setup is the one that aligns with the higher-timeframe trend and includes proper risk management.
How do you enter an SMC trade?
A typical SMC trade begins by identifying the higher-timeframe trend. Traders then wait for price to sweep liquidity, confirm a market structure shift, and retrace into an order block or fair value gap before entering. This process helps reduce the risk of entering before the market has confirmed its direction.
What is the best timeframe for SMC entries?
There is no universal timeframe, but many traders combine multiple charts. Swing traders often use the daily and four-hour charts for market bias, while intraday traders use the four-hour or one-hour chart for direction and execute trades on the fifteen-minute, five-minute, or one-minute chart.