Support
 Standard deviation: how it works in finance
Standard deviation helps explain how much variation exists within a set of data. In finance, it is used to measure historical volatility and support investment risk analysis.
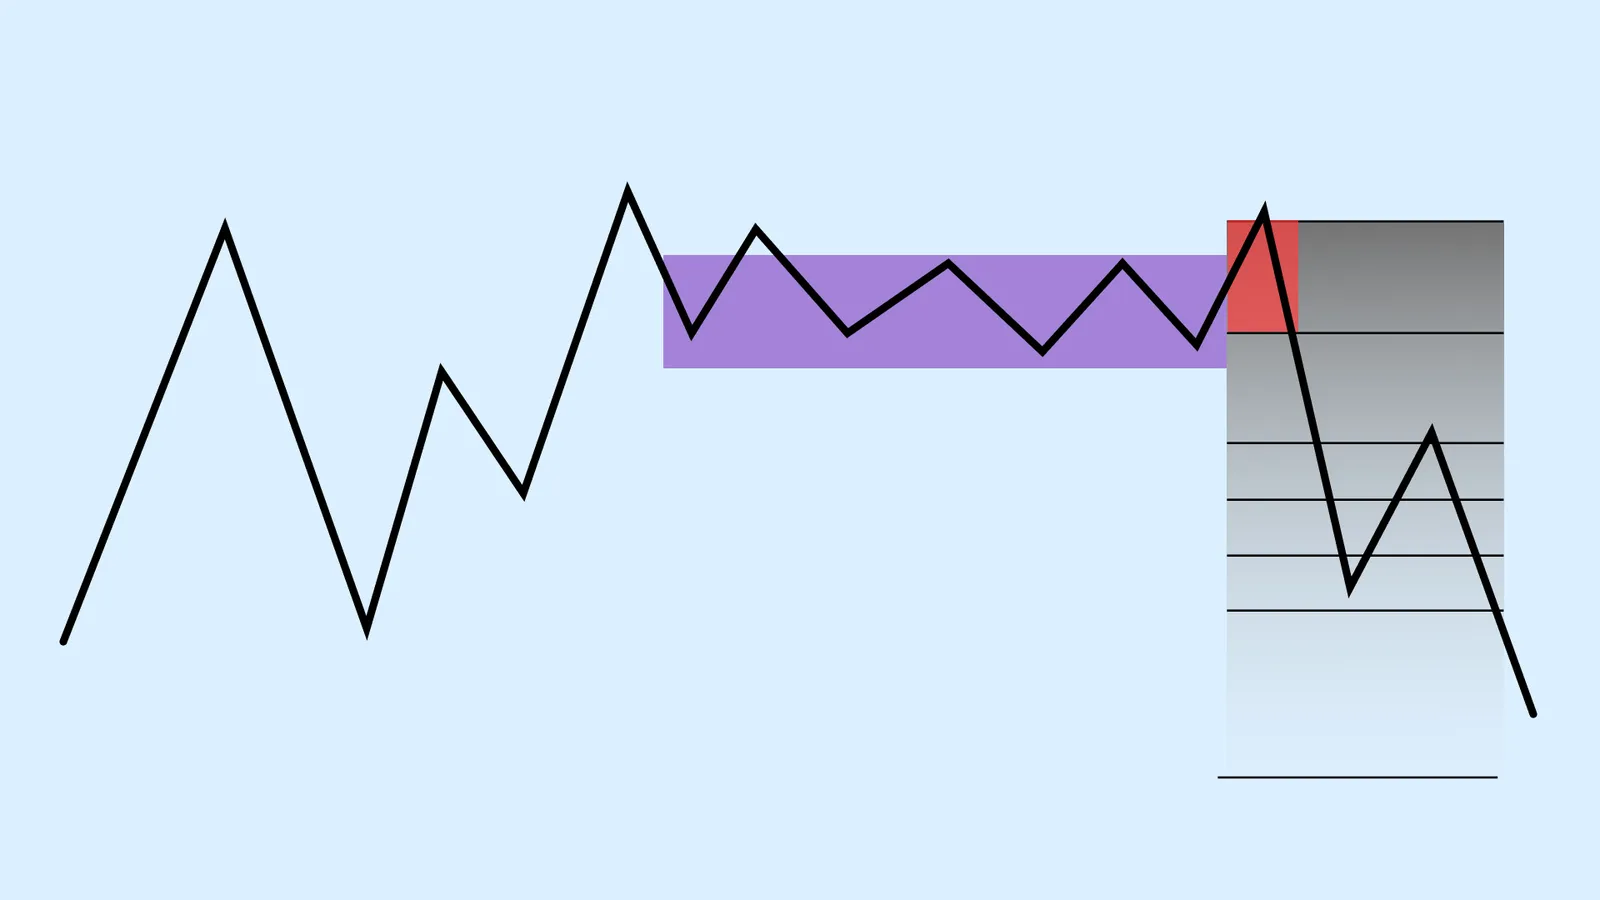
Standard deviation is derived from variance and shows the usual spread of an asset’s returns around the arithmetic mean.
Financial markets often produce “heavy-tailed” returns, where extreme price moves can exceed the usual ±3 standard deviation range.
The sample calculation uses (n – 1) to correct for bias and improve statistical inference about the wider population.
By comparing assets’ standard deviations, managers can classify risk more systematically and support diversification decisions.
What standard deviation measures
Standard deviation as typical distance from the mean
The standard deviation is a rigorous statistical measure of dispersion, represented by the Greek letter sigma (σ) for a population or the Latin letter (s) for a sample. It quantifies the spread or variability of a dataset relative to its arithmetic mean. Fundamentally, the further individual data points deviate from the average, the larger the standard deviation will be, indicating a higher degree of dispersion within the dataset.
How it relates to financial data
In financial markets and trading, the standard deviation is the most widely adopted indicator for quantifying asset volatility, achieved by analysing the historical behaviour of returns. A higher standard deviation indicates greater asset volatility on an annualised basis. Conversely, a smaller standard deviation reflects compressed price fluctuations, signifying a more stable and predictable financial instrument.
Standard deviation is traditionally conceptualised within a normal distribution, where observations tend to cluster symmetrically around the mean, with extreme events bounded within ±3 standard deviations. While this behaviour is typical of many empirical phenomena studied in classical statistics, the dispersion of financial asset returns is usually considerably higher. Financial data regularly exhibits extreme positive and negative outliers within the tails of the distribution (extending far beyond ±3 standard deviations) than a normal curve would predict.
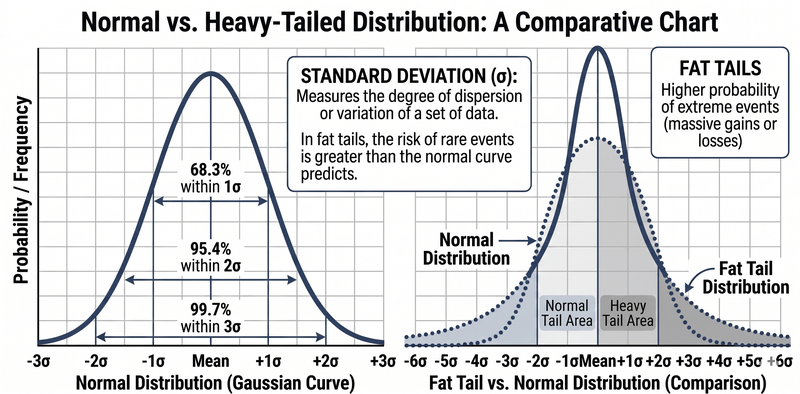
Figure 1. Normal Distribution vs Heavy-Tailed Distribution. Source: Own analysis conducted via Gemini AI.
How to calculate standard deviation step by step
Standard deviation recipe
The calculation of standard deviation is a systematised process. It requires first computing the variance of the dataset, and subsequently extracting the principal square root of that result to determine the standard deviation. The mathematical formula used to calculate the population variance is expressed as follows:
- σ² = Σ(xi − μ)² / N
Where:
- σ² = Population variance
- xi = Observation
- μ = Average of observations
- N = Number of observations
- σ = Population standard deviation
Conversely, when analysing a subset of data, the formula for the sample variance is structured as follows:
- s² = Σ(xi − x̄)² / (n − 1)
Where:
- s² = Sample variance
- xi = Observation
- x̄ = Average of the observations
- n = Number of observations in the sample
- s = Sample standard deviation
Worked example
To illustrate this process, the monthly returns of an asset over a six-month period will be analysed to determine its standard deviation. Each observation represents the percentage capital gain or loss recorded for a company's share price. The returns for each period are evaluated against their arithmetic mean to determine individual deviations. The sum of these squared deviations forms the basis of the variance. Finally, the square root of the variance is calculated to establish the standard deviation. For the purpose of this example, the sample variance formula is applied. In market practice, it is rarely feasible to calculate the absolute historical population of an asset's returns, meaning sample-based statistical inferences are commonly preferred. The step-by-step process is executed as follows:
- x̄ = [ ( 3% - 2% + 4% - 1% + 2% + 0% ) / 6 ] = [ 6% / 6 ] = 1%
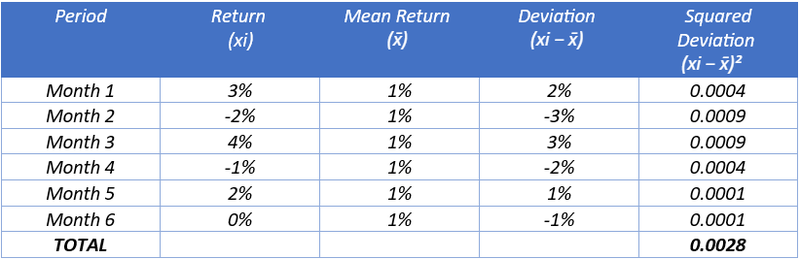
- s² = 0.0028 / (6 − 1) = 0.00056
- s = √ 0.00056 = 2.37%
Sample vs. population standard deviation
When to use N vs. N-1
Determining whether to apply the population or sample formula is essential for ensuring the statistical validity of a standard deviation analysis. In the empirical analysis of financial markets, researchers almost exclusively utilize the sample deviation formula. This preference arises because capturing the entire historical population of a financial phenomenon is highly complex and less common; nevertheless, it is possible as long as the data are available. Consequently, statistical inference is required to estimate population parameters accurately. The core distinctions between the two metrics are outlined below:
- Population standard deviation (σ): This metric must be applied exclusively when the analyst possesses complete data for every single element comprising the universe or population under definition. An example would be analysing the volatility of the constituent equities within the Dow Jones Industrial Average over a strictly bounded, closed historical period. In this scenario, the objective is purely descriptive, encapsulating the population in its entirety.
- Sample standard deviation (s): This metric must be applied when the available dataset represents a distinct fraction or subset extracted from a larger underlying population. For example, an analyst might utilize the daily returns of the S&P 500 index over the preceding calendar year as a representative sample to understand ongoing volatility dynamics. Statistical inference applied to this sample aims to estimate the broader population behaviour based on these observed sample findings.
Why standard deviation is useful
Comparing variability between datasets
The application of standard deviation is critically important across various financial applications, most notably in modern portfolio construction. Combining diverse assets characterized by distinct volatility profiles helps to mitigate the aggregate variance of an investment portfolio. However, optimal portfolio management extends beyond evaluating the isolated standard deviations of individual components; it equally requires an analysis of asset correlations and their inherent sensitivity (beta) relative to the broader market in which they trade. This comparative analysis of variability allows market participants to make highly informed capital allocation decisions.
Interpreting small vs. large standard deviations
Professional portfolio managers systematically classify financial assets according to their quantified risk parameters to align them with specific investor risk profiles. For a moderate investor profile, managers typically select defensive assets that exhibit a standard deviation below the aggregate volatility of the market index. Conversely, for aggressive risk profiles, managers select high-yielding assets that significantly exceed average market volatility, deliberately accepting a larger standard deviation in pursuit of superior capital growth.
Conclusion
The standard deviation remains an indispensable tool in modern risk management, converting the abstract concept of market volatility into a precise, quantifiable, and comparable metric. By mastering the structural distinction between sample and population data, and recognizing the systemic risk implications of heavy market tails relative to a normal distribution, financial analysts gain a significant analytical advantage. Ultimately, the rigorous calculation of this metric provides the foundational architecture that allows traders and investment managers to structure robust portfolios capable of navigating complex macroeconomic environments.
If you're interested in trading indices, foreign exchange, or commodities, consider exploring the CFD contracts offered by Equiti Group. Please note that trading leveraged derivatives involves a high level of risk and may not be suitable for all investors.
FAQs
Why is standard deviation synonymous with volatility in financial markets?
In finance, volatility represents the underlying uncertainty or risk associated with an asset's price fluctuations over time. The standard deviation mathematically quantifies the dispersion of these historical returns around their central arithmetic mean. If an asset exhibits a high standard deviation, its returns experience sharp, dramatic swings away from the average, which translates directly into elevated market volatility. Conversely, a low standard deviation indicates price stability and consistency.
When should the sampling formula (n-1) be used instead of the population formula (N)?
The sample standard deviation formula is required whenever you are analysing a subset of historical data to infer the broader operational behaviour of an asset's total lifecycle—a standard requirement in active trading (e.g., assessing the closing prices over the past rolling year). The denominator n−1 mathematically corrects for sample bias, as smaller subsets of data naturally tend to underestimate true population dispersion. The population formula (σ) is reserved strictly for scenarios where you possess every single data point in the entire historical universe.
What are "heavy tails" in the distribution of financial returns?
Under a theoretical normal distribution, approximately 99.7% of all data observations fall within ±3 standard deviations of the mean. However, empirical financial asset returns do not conform to a perfect Gaussian curve; instead, they display "heavy tails". This mathematical reality means that financial markets suffer extreme systemic shocks, resulting in massive gains or losses, far more frequently than traditional statistics would predict. Modelling risk while ignoring these heavy tails severely underestimates the exposure to catastrophic financial drawdowns.
How does standard deviation help build an investment portfolio?
Standard deviation allows portfolio managers to quantify the individual risk metrics of diverse financial instruments to group them strategically. By combining assets with contrasting volatilities and, crucially, low or negative statistical correlations, the overall variance of the collective portfolio is minimised. This allows an investor to construct a balanced portfolio where the defensive, low-deviation assets dampen the aggressive, volatile swings of high-deviation growth instruments, optimising the risk-adjusted return relative to the investor's specific profile.