Support
Stop run vs Stop hunt: how traders identify liquidity sweeps
A stop run and a stop hunt describe related price movements in which the market trades at a key technical level and triggers clustered orders. Both can produce sharp price movements around previous highs, lows, support and resistance.

A stop run occurs when price moves through a level where stop-loss and stop-entry orders are concentrated.
A stop hunt describes a price movement that traders interpret as a targeted attempt to reach liquidity.
A liquidity sweep occurs when price trades beyond a visible high or low and then returns to the other side of that level.
What is a stop run?
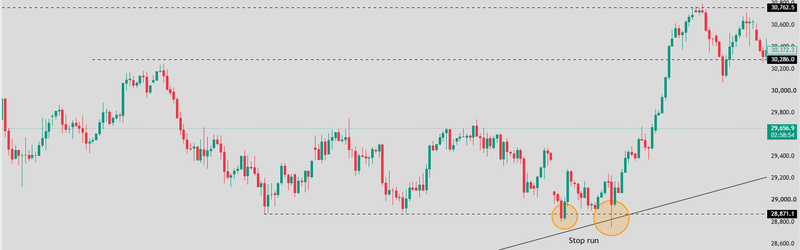
A stop run occurs when price moves through a level where stop-loss and stop-entry orders are concentrated, triggering additional orders and potentially accelerating the move.
Consider market trading near established support. Many traders have placed stop-loss orders just below that level to protect their long positions. If price breaks below support, those stops can activate and generate market sell orders, adding selling pressure to the move.
The additional selling can push prices lower, triggering more stops and creating a chain reaction. This is why a stop run can appear as a sudden, aggressive candle through a previous low or another obvious technical level.
However, not every stop run reverses
Sometimes the initial move continues because genuine selling pressure supports the breakout. The reaction after the stops is triggered helps traders assess whether the market is continuing in the same direction or rejecting the move.
Source: Trading view
What is a stop hunt?
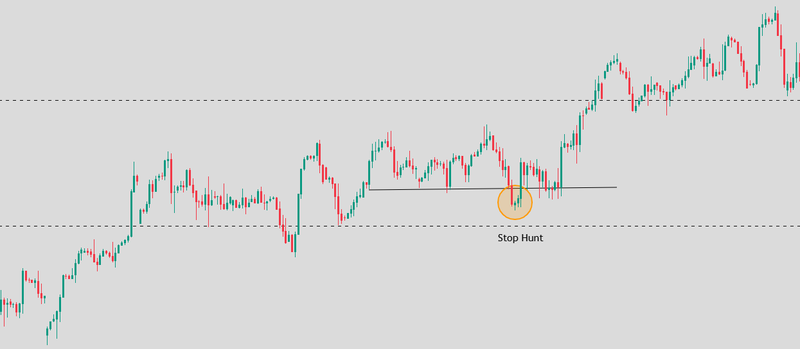
A stop hunt describes a price movement that traders interpret as a targeted attempt to reach liquidity around an obvious technical level. The idea is that large market participants need sufficient opposing orders to execute substantial positions without creating excessive market impact.
For example, a trader holding a short position may place a stop-loss above a previous swing high. Other short sellers may place their stops around the same area, while break-out traders place buy-stop orders above that high. These orders create a potential concentration of buying activity.
If price moves above the swing high, the orders can activate and increase buying pressure. A participant looking to sell a large position may find that additional buying activity provides more opportunities to execute the sale.
The important distinction is that the price movement itself does not prove deliberate manipulation. Stop hunts are a common interpretation in trading communities, but a chart alone cannot establish whether a bank, hedge fund or other participant intentionally targeted those orders. The move may also result from ordinary order flow, news, a breakout or changing liquidity conditions.
Source: Trading view
Why large traders need liquidity
Large institutions cannot always execute substantial orders at a single price without affecting the market. The size of an order relative to available liquidity determines how much market impact it may create.
Suppose an institution wants to buy a large position
If there are not enough sellers available near the current price, its purchases may consume the available sell orders and push the price higher before the full position is completed. The institution may end up paying progressively higher prices.
This is why large participants often use execution algorithms, split orders across time or seek markets with sufficient opposing liquidity. A concentration on selling orders can be useful to a buyer because those orders provide counterparties for the purchase.
Stop-loss orders can contribute to this process. When stop on long positions activate below support, they typically become market sell orders. Those sales may provide the opposing liquidity that a buyer needs to execute a purchase.
The reverse applies above resistance
Buy-stop orders from short sellers and breakout traders can generate buying pressure, potentially providing counterparties for participants looking to sell.
This mechanism explains why obvious highs and lows can attract price. It does not mean every breach is deliberately engineered by institutional traders.
Where do stop-loss orders tend to cluster?
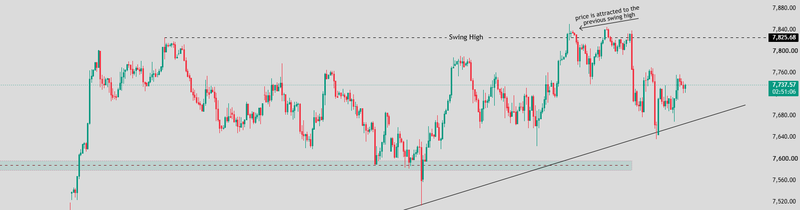
Stop-loss orders are often concentrated around levels that traders use to define their position’s invalidation points. Because many market participants follow similar technical methods, these areas can attract a relatively large number of orders.
Previous swing highs and lows are common examples. Traders holding short positions may place stops above a recent high, while traders holding long positions may place stops below a recent low.
Equal highs and equal lows can also become important
In SMC and ICT terminology, equal highs may represent buy-side liquidity, while equal lows may represent sell-side liquidity. These levels can attract stop-loss orders and breakout entries because they are visually obvious on a chart.
Other areas include previous-day highs and lows, range boundaries, major support and resistance zones, round numbers and obvious trendlines. Flag patterns can also create predictable breakout and invalidation areas.
These locations should be treated as potential liquidity zones rather than precise maps of actual orders. The full order book and the positions of other traders are generally not visible, particularly in decentralized markets such as spot forex.
Source: Trading view
Stop hunt vs. stop run: what is the difference?
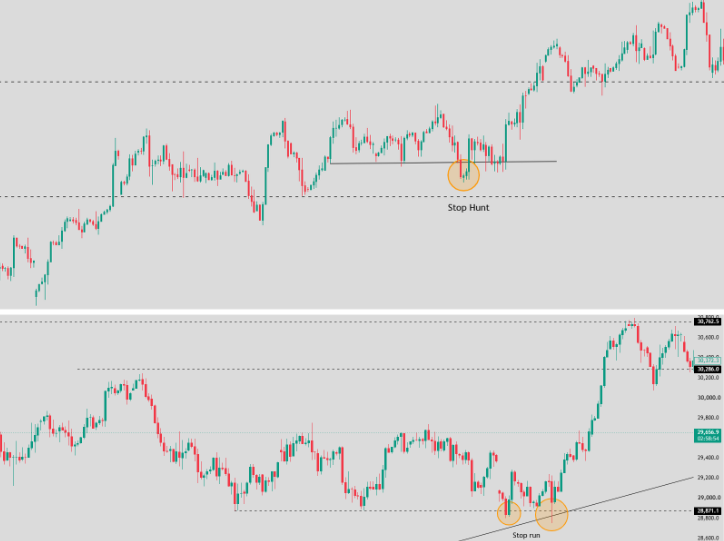
The terms are closely related, but they describe different aspects of the price movement. A stop hunt refers to the perceived targeting of a level where liquidity may be concentrated.
It focuses on the approach towards the level and the possibility that price is seeking available orders. The term often implies deliberate intent, although that intent cannot be established from price action alone.
A stop run refers to the execution phase, when price breaks through the level and clustered orders activate. The resulting order flow can accelerate the move, producing sharp candles and increased volatility.
For example, price may approach a previous high, briefly trade above it and then reverse. A trader may describe the move towards the high as a stop hunt and the burst of buying orders through it as a stop run. If price then closes back below the high, the complete pattern may be identified as a liquidity sweep.
These labels are not universally standardized. Some traders use stop hunt and stop run interchangeably, so the most useful distinction is between the suspected objective, the actual order-flow mechanics and the price reaction that follows.
Source: Trading view
How does a liquidity sweep look on a chart?
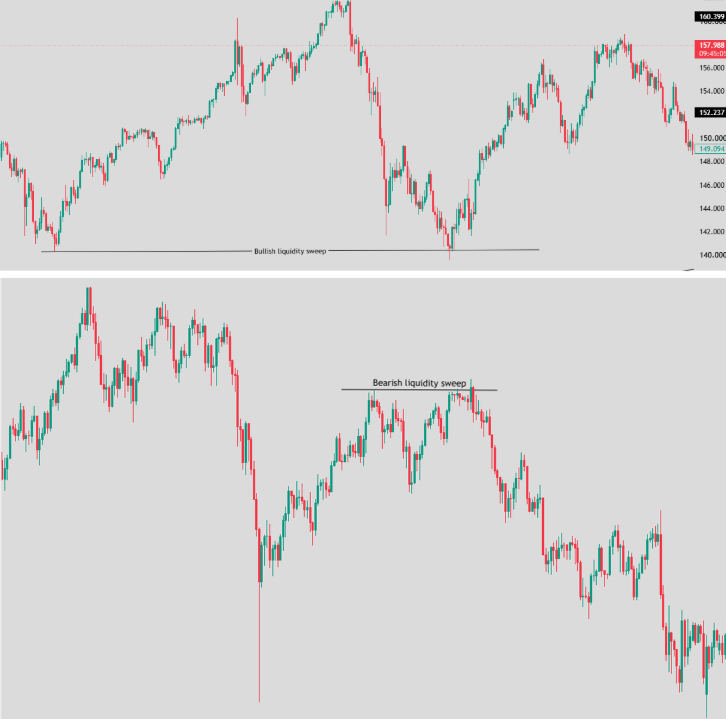
A liquidity sweep occurs when price trades beyond a visible high or low and then returns to the other side of that level. The defining feature is not simply the breach, but the rejection that follows.
In a bearish example, price rises above a previous swing high, triggering buy stops and attracting breakout buyers. Instead of holding above resistance, the market reverses and closes back below the high. This can indicate that the breakout has failed and that the buying pressure was insufficient to sustain higher prices.
In a bullish example, price falls below a previous swing low, triggering sell stops from long positions and attracting breakout sellers. Price then recovers and closes back above the low, suggesting that the breakdown has failed.
A wick through the level can provide an early clue, but a wick alone does not confirm a liquidity sweep. Traders may wait for a candle close back inside the range, followed by displacement or a market structure shift in the opposite direction.
A clean break that holds beyond the level tells a different story. If price remains above resistance or below support and continues to build structure in that direction, the move may be a genuine breakout rather than a failed attempt to reach liquidity.
Source: Trading view
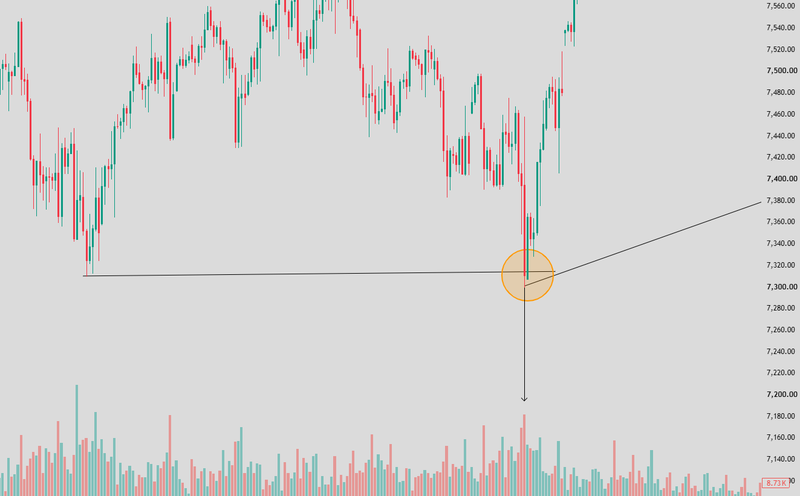
What role does volume play in a stop hunt or stop run?
Volume can help traders assess the strength of a move through a key technical level. When stop orders activate, trading activity may increase sharply, particularly in markets where order execution is concentrated around the same price zone.
A surge in volume accompanied by a sharp move through support or resistance can indicate intense trading activity. If price then reverses despite the elevated volume, traders may interpret the rejection as evidence that the breakout failed to sustain itself.
However, volume does not independently prove that a stop hunt occurred, high volume can also accompany genuine breakouts, economic announcements or other changes in market conditions.
The type of volume data matters as well
Exchange-traded futures provide exchange-reported volume, while spot forex platforms generally provide broker-specific or tick-volume data rather than a consolidated measure of all global transactions. Traders should interpret volume alongside price structure rather than treating it as direct evidence of institutional intent.
Source: Trading view
How to identify potential stop-hunting areas
The first step is to mark obvious technical levels, including previous swing highs and lows, equal highs and lows, range boundaries and previous-day extremes. These areas may attract stop-loss and break-out orders because many traders use them to make trading decisions.
Next, observe how price approaches the level. A rapid move towards an obvious high or low can precede a liquidity sweep, but it can also signal a genuine breakout. The approach alone is not enough to determine the outcome.
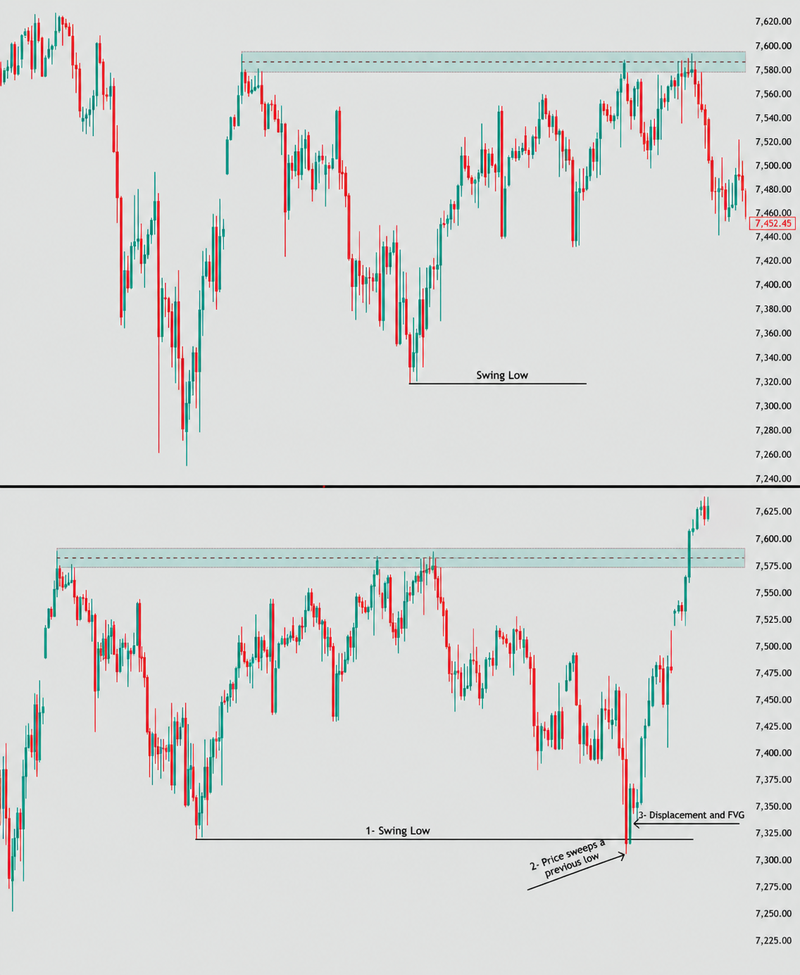
After price crosses the level, monitor whether it holds beyond the boundary or returns to the previous range. A rejection becomes more meaningful when it is followed by displacement in the opposite direction, a market structure shift or a Fair Value Gap (FVG).
For example, if price sweeps the previous day's low, closes back above it and then breaks a nearby lower timeframe swing high with strong bullish displacement, the combination may support a bullish reversal setup. A trader could then assess a retracement for a potential entry, with risk defined around the structure that would invalidate the setup.
The bearish version follows the opposite sequence
Price sweeps a previous high, rejects the breakout, moves back below the level and breaks nearby bullish structure with bearish displacement.
The objective is not to predict where every stop is located. It is to identify where liquidity may be concentrated and then wait for price to reveal whether the move is being accepted or rejected.
Source: Trading view
Risks of trading stop hunts and stop runs
The main risk is assuming that every break of support or resistance is a trap. Prices can move beyond an obvious high or low and continue in the same direction, especially when strong momentum, economic news or a genuine change in market expectations supports the move.
Another risk is entering immediately after a wick appears. A temporary breach may look like a liquidity sweep before the candle closes, but price can recover and then reverse again. Waiting for confirmation may reduce some false signals, although it can also lead to a less favourable entry price.
Stop placement matters too
Placing a stop-loss exactly at an obvious swing high or low can expose a position to normal market volatility, but moving stops excessively far away can increase potential losses. Stops should reflect the trade's invalidation level and the trader's risk limits rather than an assumption that the market will target them.
Finally, a liquidity sweep does not guarantee a reversal. Traders should define their entry conditions, stop-loss and profit target in advance, size positions appropriately and avoid increasing risk simply because a setup appears to resemble a textbook stop hunt.
FAQs
What is the difference between a stop run and a stop hunt?
A stop hunt describes the perceived targeting of a price level where stop-loss orders may be concentrated. A stop run describes the rapid price movement that can occur when those orders are triggered. The terms are often used interchangeably by traders.
What is a stop hunt in forex trading?
A stop hunt in forex trading refers to a move through an obvious high, low, support or resistance level that triggers stop-loss orders before price reverses. However, a reversal does not prove that the move was deliberately engineered.
What causes a stop run in trading?
A stop run can occur when price crosses a level containing clustered stop orders. Once triggered, these orders can generate additional market activity and accelerate price movement through the level.
Where do stop-loss orders usually cluster?
Stop-loss orders often cluster above swing highs and resistance, below swing lows and support, around equal highs and lows, near previous-day extremes and around prominent round numbers. Actual order locations are not fully visible to most traders.