
 Support
What is TradingView and how does it work?
TradingView brings together charting tools, market screeners, alerts and community analysis for traders and investors. This guide introduces the platform’s main features and how beginners can start using them.
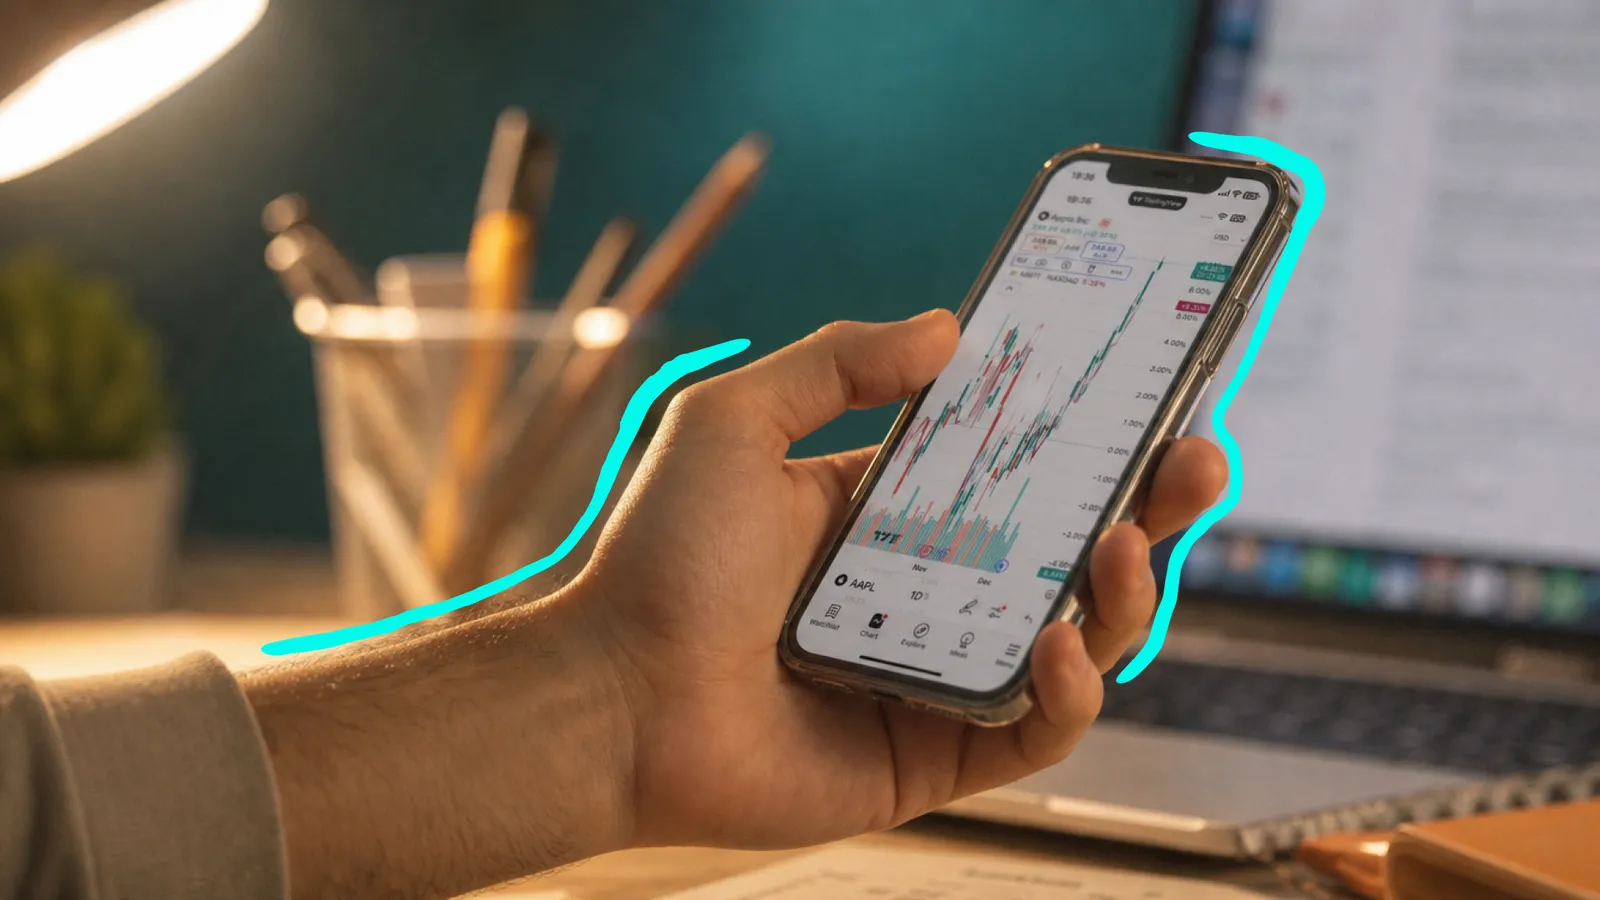
TradingView integrates charting, market analysis, screeners, alerts and social features within a single platform.
The free Basic plan allows beginners to explore charts, build watchlists and practise with simulated funds.
Paid subscriptions increase access to indicators, alerts, chart layouts and historical data, while some real-time exchange feeds may require an extra fee.
Although TradingView is not a broker, supported brokerage accounts can be linked for live trading.
Beginners should keep their setup simple at first, using one chart, a focused watchlist and a small number of indicators.
What is TradingView and what can you do with it?
TradingView is best described as a financial analysis platform with social and trading integrations. At its core, it converts financial market data into interactive charts. You can change how the data is displayed, apply technical indicators, draw on the chart, compare instruments and create alerts for particular market conditions.
TradingView also includes market screeners, financial news, economic calendars, watchlists and community analysis. Supported brokerage accounts can be connected to the platform, although TradingView itself is not a broker.
Charting and technical analysis
Charting is TradingView’s central feature. Its Supercharts workspace allows you to follow price movements across different time intervals and display the data using candlesticks, bars, lines and more specialised chart types.
The platform offers more than 20 chart types. These range from familiar candlestick and line charts to alternatives such as Renko, Kagi and Point and Figure charts. It also includes hundreds of built-in indicators and a large library of community-created scripts.
Common indicators include moving averages, the Relative Strength Index, Moving Average Convergence Divergence, Bollinger Bands and Average True Range. There are also numerous indicators based on trading volume, momentum, volatility and market breadth.
Indicators use mathematical calculations based on information such as price and volume. They may help traders organise and interpret market data, but they do not predict future prices with certainty.
Users can also apply drawing tools to identify possible support and resistance, highlight trends, measure price changes and illustrate hypothetical entry, stop-loss and profit-target levels.
Market data, screeners and watchlists
TradingView provides market data from a wide range of exchanges and data providers. Depending on the asset, exchange and subscription, prices may be real time, delayed or supplied by an alternative trading venue.
Some share and futures exchanges charge separately for official live prices. The same asset may also appear under several symbols or providers, so prices, spreads and technical readings can vary slightly. That is why it is important to check the exchange or data source before selecting a chart.
TradingView’s screeners help users search through large numbers of instruments. Shares, and ETFs can be filtered using criteria such as market capitalisation, trading volume, sector, valuation, dividend yield, volatility and recent performance.
Watchlists are used to monitor assets that already interest you. They can display prices, percentage changes, volume and selected technical or fundamental data, while symbols can be organised by market, sector, strategy or another personal category.
Social community, ideas and scripts
TradingView also functions as a social network where traders and investors can publish chart-based analysis known as Ideas. Other users can view the content, comment on it and follow the authors who publish it, with feeds organised by market, popularity or editorial selection.
Community posts can offer useful perspectives, but popularity does not guarantee accuracy. Community posts can help you discover new ideas and viewpoints, but they can reflect personal opinions or promotional interests. Use them to support your research, not replace it.
TradingView also has a Community Scripts library of indicators and strategies created with Pine Script, its programming language for market analysis tools. Users can build custom indicators, backtest strategies, create alert conditions and modify open-source scripts.
Some scripts are open source, while others are protected or available by invitation only. Beginners should understand how a script works before relying on its signals.
TradingView pricing: free and paid plans
TradingView offers a free Basic plan alongside several paid subscription options, including Essential, Plus, Premium and Ultimate.
The features available vary by plan, and prices can differ depending on your location, billing period, taxes and any promotional offers. Annual subscriptions are typically less expensive on a monthly basis than paying month by month, but it's worth checking TradingView's current pricing before choosing a plan.
What’s included in the free plan
The Basic plan includes enough features to learn the platform and carry out straightforward chart analysis.
Free users can open and customise charts, change symbols and time intervals, use common chart types, apply drawing tools and add a limited number of indicators. They can also create a watchlist, use basic screeners, view community ideas, access paper trading and connect supported brokers.
The main limitations relate to how much you can do rather than access to the platform itself. The Basic plan currently allows one chart per tab, two indicators per chart, approximately 5,000 historical bars, one watchlist with up to 30 symbols and three active price alerts. Advertising is also displayed in the free version.
For many beginners, the Basic plan is a good place to start. It gives you the opportunity to learn the platform and decide whether the additional features offered by a paid plan are worth it for your trading and analysis.
Key differences between paid plans
The main difference between TradingView's paid plans is the number of charts, indicators, alerts and historical data available. Paid subscriptions also remove advertising and include additional workspace and customisation features.
- Essential: Includes two charts per tab, five indicators per chart, approximately 10,000 historical bars, 20 price alerts and 20 technical alerts. It suits users who find the Basic plan restrictive but do not need a large workspace.
- Plus: Increases the allowance to four charts per tab, 10 indicators per chart and up to 100 price and 100 technical alerts.
- Premium: Provides eight charts per tab, 25 indicators per chart, approximately 20,000 historical bars and up to 400 price and 400 technical alerts. It is aimed at more active traders.
- Ultimate: Offers the highest limits, with up to 16 charts per tab, 50 indicators per chart, approximately 40,000 historical bars and up to 1,000 price and 1,000 technical alerts.
Features and limits may change over time, so it's worth checking TradingView's current pricing before choosing a subscription.
The right plan depends on how you use TradingView. A longer-term investor may need little beyond the free plan, while an active trader comparing several markets and timeframes may benefit from higher limits. Features can change, so check TradingView’s current pricing before subscribing and choose a plan based on the tools you will genuinely use.
Add-ons and data subscriptions
A paid TradingView plan does not automatically include official real-time data from every exchange. Some stock and futures exchanges charge separate data fees, which may vary depending on whether you're a professional or non-professional user.
Before subscribing to a data feed, it's worth checking whether the prices you're viewing are delayed and whether your connected broker already provides the market data you need. TradingView usually labels delayed prices and shows the relevant exchange or data source in Symbol Search and the chart's market status area.
Getting started: Set up your account and first chart
Creating a TradingView account allows you to save chart layouts, build watchlists, set alerts and personalise the platform. Beginners should start with a simple workspace and focus on learning the main controls before adding more advanced tools.
1. Create your profile and review the settings
Create a free Basic account and choose your username carefully, especially if you plan to publish Ideas or interact with the community.
Review the appearance, language, time zone, notification and privacy settings. Use a unique password and enable two-factor authentication, particularly before connecting a brokerage account.
2. Find a symbol and choose the correct market
Open Symbol Search in Supercharts and search by company name, ticker or trading pair.
Check the full symbol details before selecting a result, as similar listings may represent different exchanges, providers, contracts or currencies. Choose a widely traded instrument for your first chart and add it to your watchlist.
3. Select a timeframe and chart type
Choose an interval based on how much time each candle or bar should represent. Remember that the interval differs from the date range, which controls how much market history appears on screen.
Candlestick charts are a practical starting point, while line and bar charts offer alternative views. More specialised options, such as Renko and Point and Figure, can be explored later. Choosing time frames and chart types
The chart interval determines how much time each candle, bar or plotted point represents. For example, each candle on a five-minute chart covers five minutes of trading, while each candle on a daily chart represents one trading day.
The interval is different from the visible date range. The interval controls what each candle shows, while the date range determines how much market history appears on the screen.
Candlestick charts are a practical starting point because they show the opening, highest, lowest and closing prices for each interval. Line charts offer a simpler view, while bar charts display similar information to candlesticks in a different format.
More specialised options, such as Renko and Point and Figure charts, organise price data differently and are best explored after you understand the standard chart types.
Navigating the TradingView interface
The TradingView interface is organised into several main areas. The chart sits at the centre of the screen, with chart controls across the top, drawing tools on the left and additional information panels on the right. Preset date ranges, time-zone controls and price-scale settings are located along the bottom.
At first glance, the number of buttons and menus can seem overwhelming. In reality, beginners only need a handful of key features to get started, including Symbol Search, chart intervals, chart types, Indicators, drawing tools, the Watchlist and Alerts.
Top toolbar: chart controls and layouts
The top toolbar controls the chart’s main configuration. From this area, you can change the symbol, add a comparison symbol, choose an interval and select a chart type. You can also search for indicators, create alerts, use Bar Replay, undo recent changes and open chart settings.
Layout controls are also located in the upper section of the workspace. Depending on your plan, you may be able to display several charts within one browser tab. These charts can be configured independently or synchronised by symbol, interval, crosshair position or drawings.
A single-chart layout is normally the best option while learning. Multiple charts become useful when comparing different timeframes or following several related markets.
The exact position and appearance of individual controls may change as TradingView updates the platform, but the overall purpose of the top toolbar remains the same: selecting what you want to analyse and deciding how it should appear.
Left toolbar: drawing and annotation tools
The left toolbar contains drawing, annotation, measurement and forecasting tools. Horizontal lines can be used to mark previous highs, lows or other important price levels. Trendlines can connect rising lows or falling highs, while parallel channels can illustrate an upward, downward or sideways trading range.
The toolbar also includes Fibonacci and Gann tools, geometric shapes, text labels, pattern tools and hypothetical long or short position drawings.
The measurement tool can be particularly useful for beginners. It displays the percentage price change, number of bars and elapsed time between two selected points.
TradingView also includes a magnet function that attaches drawings to nearby opening, high, low or closing prices. Drawings can be locked after placement to prevent them from being moved accidentally.
Drawing tools should be used with restraint. A chart covered in lines, labels and coloured areas often becomes more difficult to interpret than a clean chart.
Right and bottom panels: watchlists, ideas, alerts and more
The right side of the workspace provides access to additional market information and account activity without requiring you to leave the chart.
This area includes watchlists, symbol details, news, alert management, economic calendars, screeners, community feeds and social notifications. The exact selection can vary depending on the market and account type.
The Object Tree is also available from this area. It lists the indicators, drawings and symbols applied to the current chart, making it easier to locate, hide, group or remove individual objects.
At the bottom of the chart, you will find date-range controls, time-zone settings and price-scale options. An expandable lower panel also provides access to features such as the Pine Editor and Trading Panel.
The Pine Editor is used to create and modify Pine Script indicators and strategies. The Trading Panel is where users connect TradingView Paper Trading or a supported external broker.
Core charting features beginners should learn
TradingView offers a wide range of charting tools, but beginners don't need to learn everything at once. Focusing on a few core features first will help you become familiar with the platform and build confidence as you analyse the markets.
Start with a single chart, one or two indicators, a few horizontal support and resistance levels, and a simple watchlist. As you become more comfortable using the platform, you can gradually explore additional tools and features that support your analysis.
Indicators and how to customise them
Select Indicators from the top toolbar to search TradingView’s library. It includes built-in indicators, community scripts, strategies and financial metrics, although built-in tools are usually the clearest place to begin.
Some indicators appear over the price chart, while others open in a separate panel below it. Their settings can be used to adjust elements such as the calculation period, input source, timeframe and appearance.
For example, you can change the number of periods used by a moving average or adjust the calculation length and reference levels of the Relative Strength Index.
Avoid using several indicators that measure the same type of market behaviour, as this can create misleading confirmation. Once you find a useful combination, save it as an indicator template so you can apply the same settings to other charts.
Drawing tools: trendlines, fibonacci tools and measurements
Drawing tools allow you to record your interpretation directly on the chart. Horizontal lines are commonly used to mark previous highs, previous lows and other clearly defined price levels. Trendlines can connect relevant swing points, although they should not be forced to fit the price simply to support a preferred conclusion.
Parallel channels use two boundaries to illustrate a rising, falling or sideways range. Fibonacci retracement tools plot a selection of percentage levels between two chosen price points. Some traders use these levels as potential areas of support or resistance, but they should not be treated as guaranteed reversal points.
The measurement tool calculates the price difference, percentage movement, number of bars and time elapsed between two points. This is useful when comparing previous market moves or examining how quickly a price change occurred.
TradingView’s long and short position tools can illustrate a hypothetical entry, stop level and target. They can also display an estimated risk-to-reward ratio. These drawings are visual planning tools and do not place a live order by themselves.
Every drawing should have a clear purpose. Removing unnecessary objects will usually make a chart easier to interpret.
Alerts, templates and saved layouts
Alerts notify you when a selected market condition occurs, reducing the need to watch the chart continuously. A price alert can trigger when an instrument reaches, crosses or moves beyond a specified value. A technical alert can use an indicator, drawing, strategy or chart pattern as its condition. Some paid plans also support alerts that apply across an entire watchlist.
Alerts can be created from the top toolbar, the Alert Manager, a drawing, the price scale or the chart’s context menu. Available notifications may include mobile messages, browser notifications, emails, sounds and webhooks.
Always check the alert’s symbol, condition and interval before saving it. Technical alerts can depend on a specific chart timeframe, and changing the visible chart afterwards does not necessarily change the alert’s original configuration.
A chart layout stores the wider workspace, including chart settings, indicators, drawings and the most recently selected symbol and interval. Clear layout names make saved workspaces easier to manage.
TradingView supports both manual saving and autosave. Paid plans generally allow more saved layouts and more charts within each layout.
Trading on TradingView: brokers and demo trading
TradingView can be used for both simulated and live trading. Beginners can practise with Paper Trading, while users with supported brokerage accounts can connect them to the platform and place orders directly from the charting interface.
How to connect a broker and place trades
The exact connection process varies slightly between brokers, but the general steps are:
- Open Supercharts and select Trade or open the Trading Panel at the bottom of the workspace.
- Choose a supported broker from the available list.
- Select Connect and sign in through the broker’s authorised login process.
- Choose the correct live, demo or paper account.
- Confirm that the intended account is active before creating an order.
Once connected, orders may be placed through an order ticket, chart-based controls or other methods supported by the broker.
Before submitting an order, verify the symbol, exchange, buy or sell direction, order type, quantity and price. You should also check any stop-loss or take-profit settings, estimated trading costs, margin requirements and whether the account is live or simulated.
TradingView’s own Paper Trading system uses virtual funds and does not require a deposit. It allows users to practise trading various asset classes and adjust settings such as the starting balance, account currency, commission and leverage.
Paper trading is useful for learning how the platform works, but it cannot reproduce every aspect of live execution. Simulated results may not fully reflect slippage, liquidity, changing spreads, emotional pressure or the possibility of an order failing to fill.
FAQs
Is TradingView a broker?
No. TradingView is a charting and market analysis platform, not a broker. It allows users to connect supported brokerage accounts, but the broker holds client funds, manages the trading account and executes live orders.
How do you connect a broker and place trades on TradingView?
Open Supercharts and select trade, or open the trading Panel at the bottom of the screen. Choose a supported broker, select connect, sign in to your account and confirm whether you are using a live or paper-trading account before placing an order.
Is TradingView free to use?
Yes. TradingView offers a free Basic plan with access to charts, drawing tools, screeners, watchlists, paper trading and a limited number of indicators and alerts. Paid plans increase these limits and provide additional features.
Can I trade directly on TradingView?
Yes. You can place trades through TradingView by connecting a supported broker or using its Paper Trading feature. Live orders are submitted through the platform but executed by the connected broker.
What markets are available on TradingView?
TradingView covers a broad range of markets, including stocks and shares, exchange-traded funds, forex, indices, futures and bonds. The instruments and data available depend on the exchange, provider and subscription.
Can I create custom indicators on TradingView?
Yes. TradingView’s Pine Script programming language allows users to create custom indicators, strategies and alert conditions. Users can also explore, copy or modify open-source scripts published by the TradingView community.
Does TradingView have a mobile app?
Yes. TradingView has mobile apps that allow users to check charts, follow watchlists, monitor markets and receive alerts. The platform is also available through web browsers and a desktop application.
Does TradingView provide real-time data?
TradingView provides real-time data for many markets, but availability depends on the exchange and data source. Some stock and futures exchanges charge separately for official live data. Other feeds may be delayed or supplied by an alternative trading venue.


