Support
A guide to XAUUSD liquidity mapping
In gold trading, liquidity often builds around visible highs, lows and order clusters. XAUUSD liquidity mapping helps traders read these areas and understand how price may move between them.
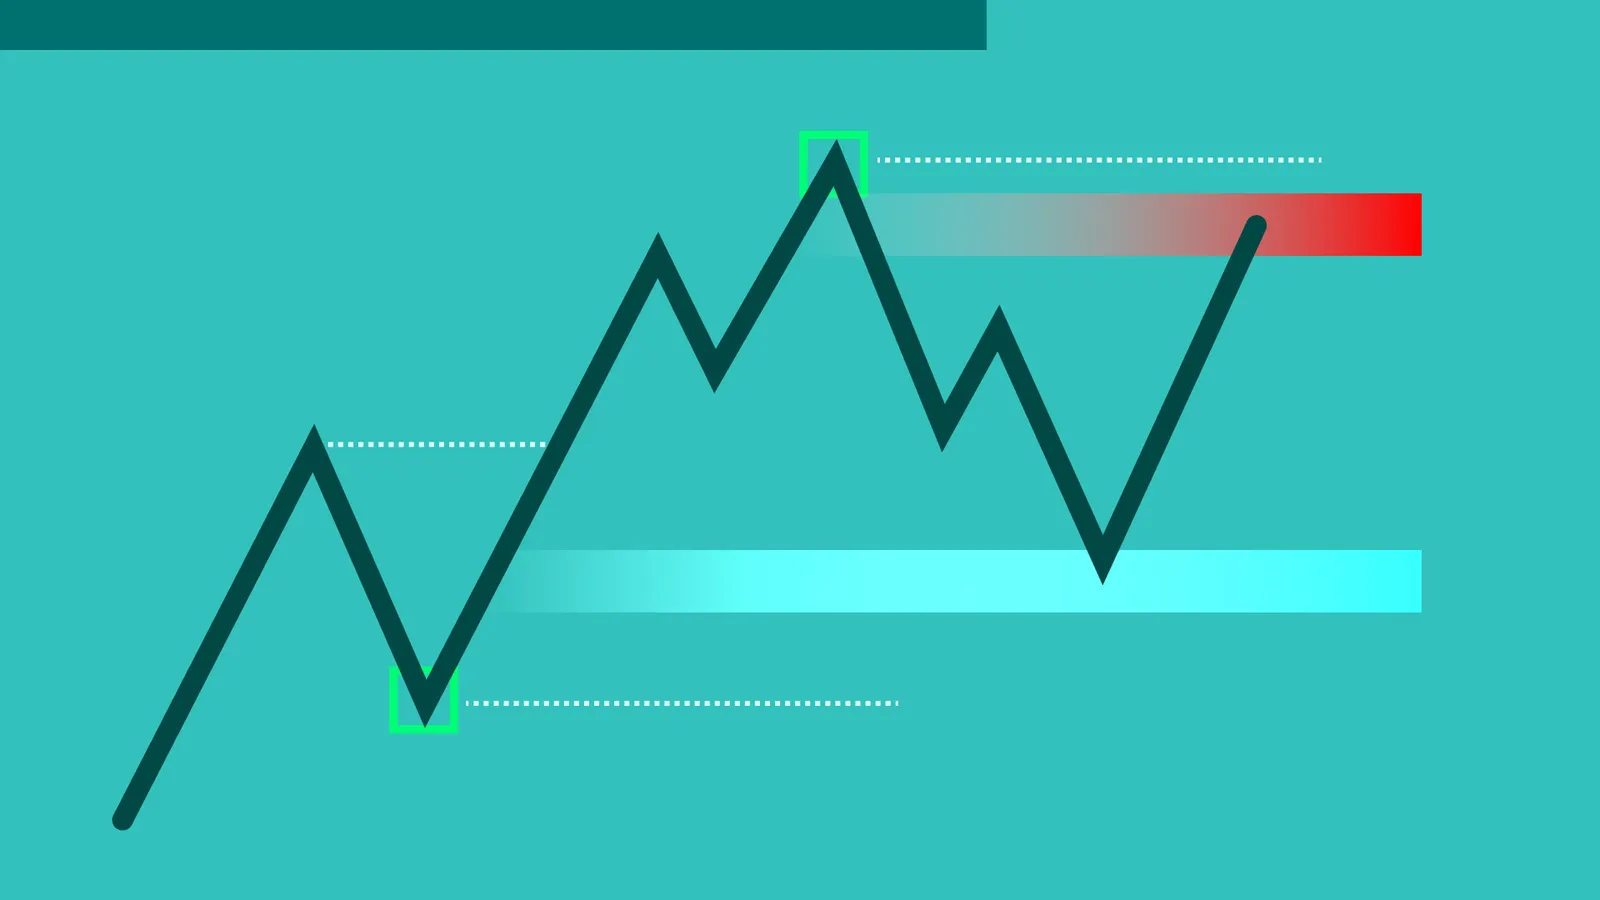
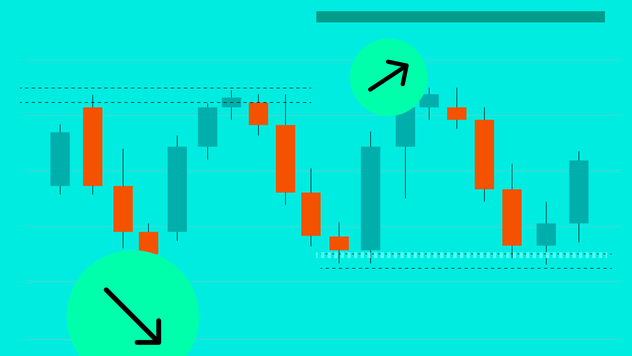
Gold frequently moves towards areas where liquidity is concentrated.
Earlier highs and lows can attract clustered stop orders.
Price may sweep liquidity before the main direction develops.
Volatility often rises around news releases and session opens.
What is XAUUSD liquidity mapping?
XAUUSD liquidity mapping is the process of identifying price areas on the gold chart where large clusters of orders may be sitting. These areas often include stop-loss orders, breakout orders, pending entries and positions from traders reacting to obvious support and resistance levels.
In simple terms, liquidity is where orders are available. Price needs liquidity to move. When gold approaches an obvious high, low or round number, traders often assume the level will either hold as resistance or break as momentum. That concentration of orders can make the area attractive for sharp price moves.
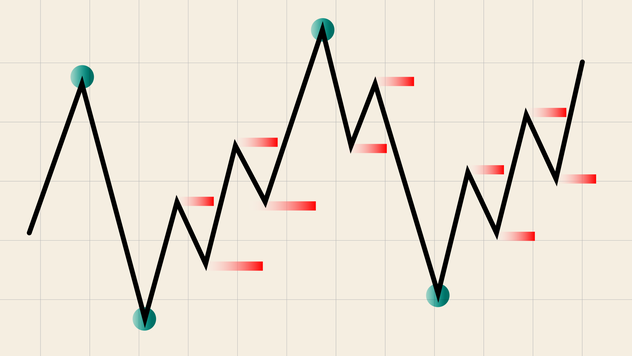
In smart money concepts, traders often describe this as the “path of liquidity.” The idea is that gold does not move randomly from one price to another. It often moves from one liquidity pool to the next, sweeping stops, triggering breakout traders, filling imbalances and then pushing toward the next obvious target.
This does not mean traders can know exactly where institutions are buying or selling. Real institutional order flow is not fully visible on a normal retail chart. But liquidity mapping gives traders a framework for reading where price may be drawn next and where false breakouts are more likely to happen.
Why liquidity matters in gold trading
Gold is one of the most active and sensitive markets in the world. It reacts to the US dollar, Treasury yields, inflation data, Federal Reserve expectations, geopolitical stress and shifts in risk sentiment. That makes XAUUSD fast, emotional and often aggressive around key technical levels.
This is why liquidity matters. Gold frequently makes sharp moves through obvious highs or lows before reversing. To new traders, this looks like manipulation. To experienced price-action traders, it often looks like liquidity being taken before a larger move develops.
A liquidity sweep can clear weak positions from the market. For example, if many traders place stop-losses just above a previous high, a quick move above that high can trigger those stops. If price then fails to hold above the level and reverses lower, the breakout was not a clean continuation. It was a liquidity grab.
The main XAUUSD liquidity zones
The best liquidity zones in gold are usually the most obvious levels on the chart. If a level is easy for everyone to see, it is more likely to attract orders.
Previous daily highs and lows
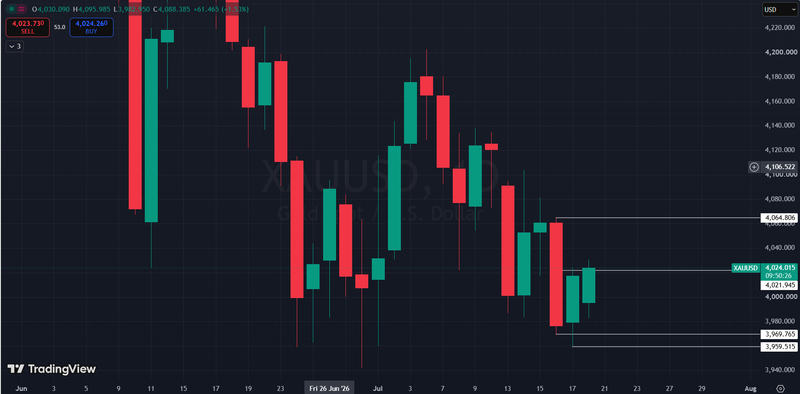
Previous daily highs and lows are among the most important XAUUSD liquidity zones. Traders often place stops above the previous day’s high when shorting, and below the previous day’s low when buying. Breakout traders also place buy stops above highs and sell stops below lows.
That is why gold often reacts sharply when it reaches these levels. A move above the previous daily high may either continue strongly or quickly reject. The reaction after the sweep is more important than the sweep itself.
Previous weekly highs and lows
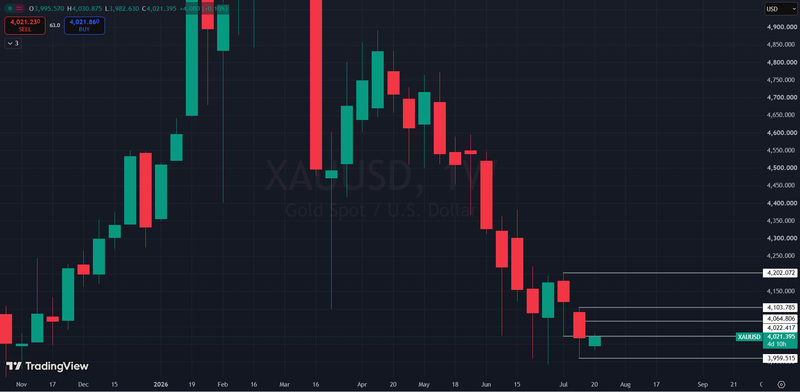
Weekly highs and lows are larger liquidity pools because they are watched by higher-timeframe traders. Swing traders, fund managers and technical traders often use weekly levels to define broader market structure.
If gold is trading inside a weekly range, the previous weekly high may act as a magnet for price. Once that level is swept, traders then watch whether gold accepts the breakout or rejects back into the range.
Equal highs and equal lows
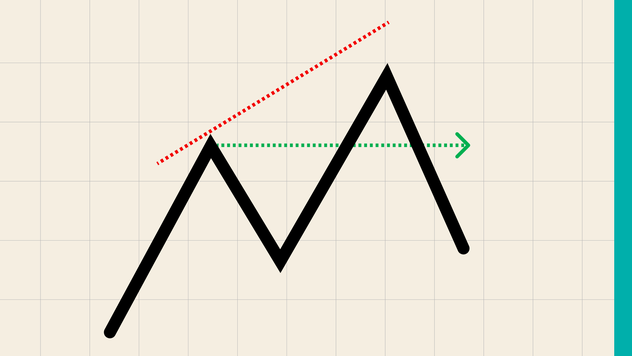
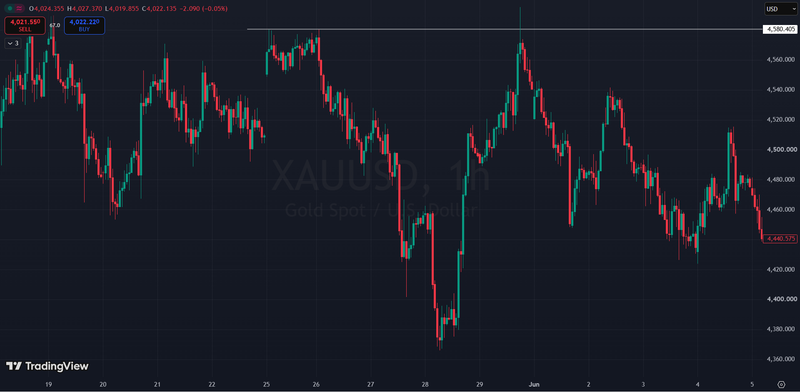
Equal highs and equal lows are classic liquidity magnets. Equal highs usually form when gold repeatedly fails near the same resistance area. Retail traders often see this as a double top and place stops just above it. Equal lows work the same way in reverse.
Because the stop placement is predictable, these zones often attract sharp liquidity runs. A clean sweep above equal highs followed by bearish displacement can signal that buyers were trapped. A sweep below equal lows followed by bullish displacement can signal that sellers were trapped.
Psychological round numbers
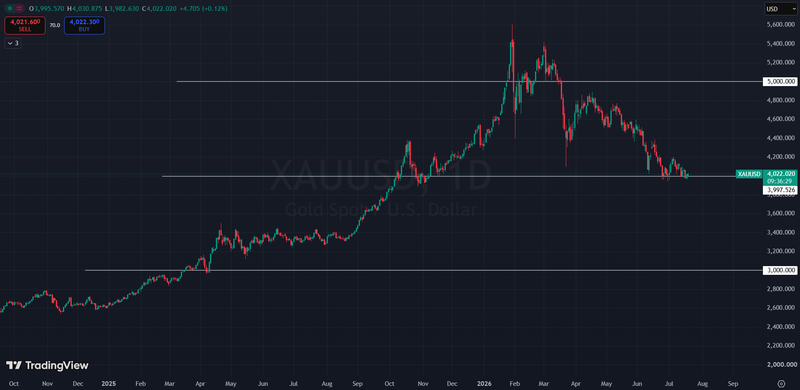
Gold traders pay close attention to round numbers such as $3000, $4000, or $5000. These levels attract attention because they are simple, memorable and widely watched.
Round numbers can hold as support or resistance, but they can also become liquidity traps. A brief push above a major psychological level can pull in breakout buyers before price reverses. A brief break below a round number can trigger panic selling before gold rebounds.
Trendlines
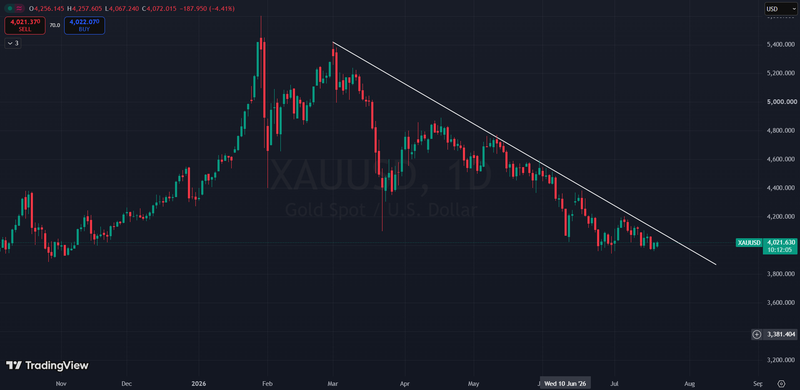
Retail trendlines are another common source of liquidity. Traders often draw the same rising or falling trendline and place stops just beyond it. When gold breaks the trendline, stops are triggered and breakout traders enter.
But the first break is not always the real move. Gold may break a trendline, collect liquidity, then return inside the structure. This is why liquidity traders avoid entering only because a line breaks. They wait for confirmation.
Fair value gaps and order blocks
Fair value gaps and order blocks are different from simple highs and lows. They are based on imbalance.
A fair value gap forms when price moves so aggressively that part of the move is left inefficient or thinly traded. Traders mark that gap as a possible retracement zone.
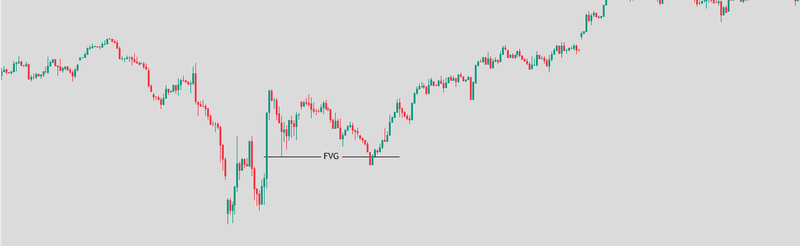
An order block is usually seen as the last bullish or bearish candle before a strong institutional-style move.
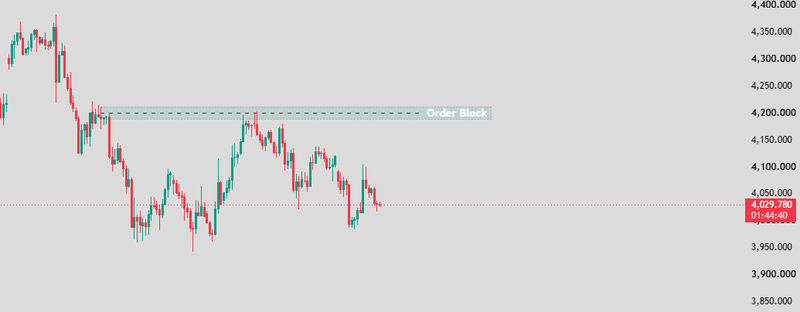
In XAUUSD liquidity mapping, traders use fair value gaps and order blocks as areas where price may return before continuing in the direction of the displacement. They are not magic zones. They work best when they align with a sweep, a structure shift and a broader liquidity target.
The path of liquidity in XAUUSD
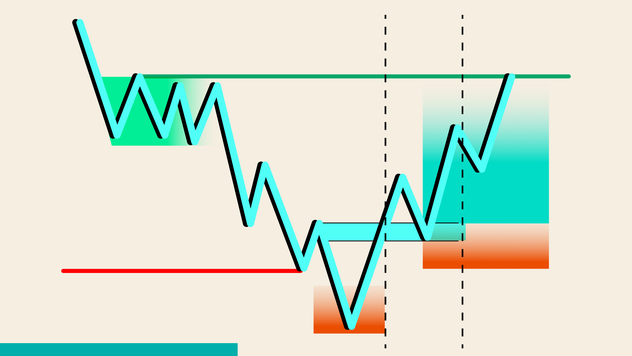
The path of liquidity usually follows three stages: sweep, reaction and displacement.
Liquidity sweep
The first stage is the sweep. Price moves beyond an obvious level such as a previous high, previous low, equal high, equal low or round number. This triggers stop-losses and breakout orders.
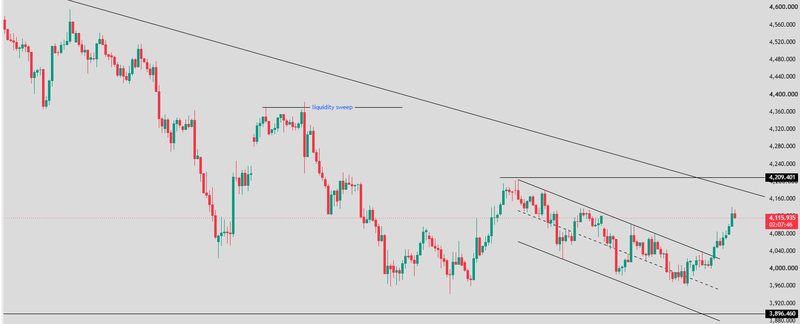
A sweep alone is not enough. Gold can sweep a level and continue trending. The key is what happens after the sweep. If price quickly returns back below a swept high or back above a swept low, it may show a failed breakout.
Accumulation or distribution
After a sweep, gold may enter a small range. This is where traders look for signs of accumulation or distribution.
Accumulation usually means buyers are absorbing selling pressure near the lows. Distribution usually means sellers are absorbing buying pressure near the highs. On the chart, this can look like sideways movement, repeated failed pushes, long wicks or slowing momentum.
This stage requires patience. Entering too early is one of the biggest mistakes in liquidity-based gold trading. A level can be swept more than once before the real move begins.
Displacement
Displacement is the confirmation stage. It is a strong move away from the swept level, often with a large candle or series of candles that breaks short-term structure. This move shows that one side has taken control.
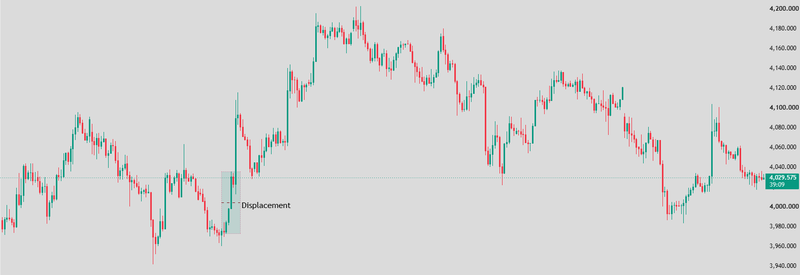
A bullish displacement after a sweep of lows can indicate that sellers were trapped and buyers are now driving price higher. A bearish displacement after a sweep of highs can indicate that buyers were trapped and sellers are taking control.
Displacement often leaves behind a fair value gap. Traders may then watch for price to return into that gap for a potential entry, with the next liquidity pool used as the target.
Best timeframes for XAUUSD liquidity mapping
XAUUSD liquidity mapping works best when traders combine multiple timeframes.
The daily and weekly charts help define the major liquidity pools. These include prior highs, prior lows, weekly ranges, major imbalances and large psychological zones.
The one-hour and four-hour charts help define direction and structure. Traders use these timeframes to see whether gold is trending, ranging or preparing to sweep a major zone.
The five-minute and fifteen-minute charts are often used for execution. This is where traders look for the sweep, displacement, fair value gap and short-term structure shift.
The key is not to overload the chart. A clean liquidity map should answer three questions: where is price likely to draw liquidity, what level must be swept first, and where is the next target if direction confirms?
High-liquidity sessions for gold
Gold tends to be most active during the London and New York trading sessions. These periods bring higher participation, stronger volatility and more frequent liquidity sweeps.
The London session often sets the first major directional move of the day. It can sweep Asian session highs or lows, create the first meaningful displacement, and establish the day’s early range.
The New York session is even more important for XAUUSD because gold is priced in US dollars and reacts heavily to US yields, economic data and Federal Reserve expectations. The New York open can create sharp moves, especially if price is already near a major liquidity zone.
Many traders focus on the London window, the New York morning session, and the New York afternoon session. These periods often provide cleaner volatility than quiet trading hours.
News events and liquidity sweeps
Major economic events can turn normal liquidity zones into high-volatility traps. FOMC decisions, US CPI, Non-Farm Payrolls, unemployment data and major geopolitical headlines can all create violent moves in gold.
During these events, gold may sweep both sides of a range before choosing direction. This is especially common when the market is positioned heavily in one direction before the release.
The danger is trading too early. A first spike after news is often emotional. The better approach is to wait for the liquidity sweep, let volatility settle, then look for structure. If price sweeps a high, rejects, breaks short-term structure and leaves a fair value gap, the setup becomes clearer. If price only spikes without confirmation, it is noise.
A practical XAUUSD liquidity strategy
A simple liquidity-based approach starts with preparation, not prediction.
First, mark the previous daily high and low. Then mark the previous weekly high and low. Add equal highs, equal lows, major round numbers and clear trendline liquidity. After that, identify nearby fair value gaps or order blocks that could act as return zones.
Second, wait for price to reach one of those liquidity areas. Do not enter just because price is close to the level. Gold can run levels aggressively, especially during London, New York or news events.
Third, wait for the sweep. A bullish setup often begins with price taking out a key low and then reclaiming the level. A bearish setup often begins with price taking out a key high and then falling back below it.
Fourth, look for displacement. The market should move away from the swept level with strength. A small candle is not enough. Traders want to see a clear shift in momentum.
Fifth, use the fair value gap or order block for entry planning. The idea is not to chase the displacement candle. The cleaner setup often comes when price retraces into the imbalance before continuing.
Finally, target the next major liquidity pool. If gold sweeps lows and confirms higher, the target may be equal highs, the previous daily high or a weekly level. If gold sweeps highs and confirms lower, the target may be equal lows, the previous daily low or an unfilled imbalance below.
Risk management matters more than the setup
Liquidity mapping is useful, but it is not a guarantee. Gold can sweep a level and keep going. It can reject and then reverse again. It can also become chaotic during major news.
That is why risk management must come first. Traders should define invalidation before entering. In many liquidity models, the stop is placed beyond the swept wick or beyond the structure that should not be broken if the setup is valid.
Position size also matters. XAUUSD moves fast, and small mistakes can become large losses when leverage is used. Liquidity mapping should reduce emotional trading, not increase it.
The goal is not to catch every gold move. The goal is to wait for a clean sweep, clear displacement, logical retracement and a realistic target. Patience is the edge.
FAQs
What is XAUUSD liquidity mapping?
XAUUSD liquidity mapping is the process of identifying price zones on the gold chart where stop-loss orders, breakout orders and pending entries are likely to be concentrated.
What is the path of liquidity in gold trading?
The path of liquidity means the likely movement of gold from one liquidity pool to another. Traders use it to identify where price may sweep stops before moving toward the next major level.
What are the best liquidity zones for XAUUSD?
The most important XAUUSD liquidity zones are previous daily highs and lows, previous weekly highs and lows, equal highs, equal lows, psychological round numbers, trendlines, fair value gaps and order blocks.
What is a liquidity sweep in XAUUSD?
A liquidity sweep happens when gold moves beyond an obvious high or low, triggers stop-losses or breakout orders, and then quickly reverses or confirms a new direction.
What is the best session for XAUUSD liquidity trading?
The London and New York sessions are usually the most active for XAUUSD. The New York session is especially important because gold reacts strongly to US economic data, Treasury yields, the dollar and Federal Reserve expectations.
How do fair value gaps help in XAUUSD trading?
Fair value gaps help traders identify imbalance zones created by strong moves. After a liquidity sweep and displacement, price may return to a fair value gap before continuing toward the next liquidity pool.