
A week ago, the US Dollar Index completed one of its longest declining stake since 2002, posting six monthly declines in a row, which deepen the bearish outlook on the short and medium term.
Two weeks ago, the US Dollar Index has been trading within a long term support area, which stands between 91.80 and 93.0 as shown on the weekly chart. This area has been supporting the index since January of 2015.
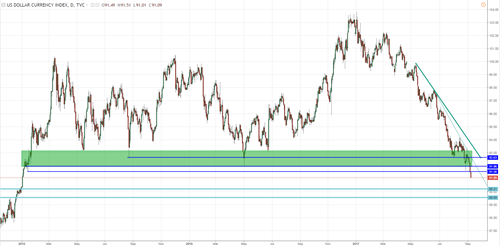
However, this time, it managed to support the index for few days only, before it continued to decline further.
Earlier in Asia, the US Dollar Index declined all the way to 91.0, which is well below the 91.80 long term support, reaching the lowest level since the 1st of January of 2015.
Looking at the daily and the weekly chart, there is no signs of strength, or a short-term retracement to the upside anytime soon. Today’s weekly close might be the first weekly close below that support area since December of 2014.
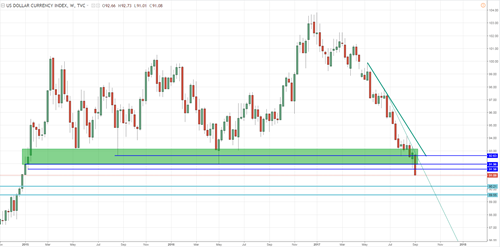
If so, the US Dollar index next targets would be toward 90.20’s, 90.0 barrier and 89.55, while any upside retracement would probably be limited below 91.80.
Safe Haven Assets Remains Strongly Bullish
Amid the global geopolitical tensions, safe haven assets are on the rise. However, for the past few days, the US Dollar weakness is one of the major reasons for the current rally.
Gold, Silver, Japanese Yen and the Swiss Franc are under the spotlight over the past few weeks. Gold is now in a clear breakout formation, side by side with Silver, while the USDJPY tumbled to as low as 107.40, which is the lowest level since November of 2011, which keeps the possibility for further declines ahead. Probably toward 105.50’s
Gold 1400 Next?
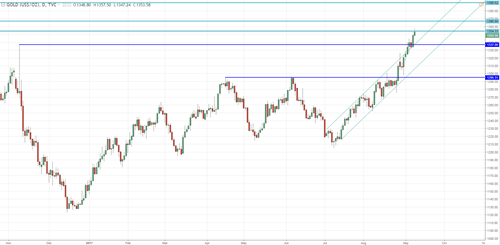
There were a lot of talks about a notable breakdown in Gold at the beginning of this year. However, Gold has surprised almost everyone and managed to break above 1300 barrier few weeks ago, which upgrades the outlook to strongly bullish.
Earlier this morning, Gold managed to test 1356 resistance area, which is the highest level since August of 2016.
A break above that resistance (daily and weekly close) would clear the way for further gains, probably toward the next resistance which stands at 1366.
Above those levels, there is no significant resistance areas before 1390 and 1400 barrier, where things will be more interesting, especially if bulls were able to break above 2014 highs.
Silver 18.50 Could Be Next
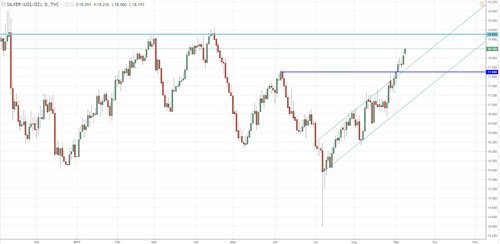
Silver has finally proved that it is strong enough to recover more than 10% of this year’s decline after the flash crash in July of this year.
Silver managed to break above 17.50 last week, continued to rise earlier this week breaking above 18.0 During the Asian session, reaching as high as 18.20.
In the meantime, amid the current USD weakness, the possibility for another rally is here to stay, at least before the end of the week. The first immediate resistance stands at 18.50, which should be watched very carefully, as a break above that resistance would be the first break since October of last year, which opens the way for another rally, probably toward $19.
On the downside view, any retracement is likely remain limited between 17.50 and 17.60, before the upside trend resumes.
Edited by:
Nour Eldeen Al-Hammoury
Market Analyst