With no surprises, the Federal Reserve decided to keep the current Fed Fund Rate between 1.0% and 1.25% as widely expected. Yet, what mattered the most as we said in yesterday’s article is the Balance Sheet trimming decision, Dot Plot and the economic projections.
Fed To Start Reducing Balance Sheet in October
This is biggest story in the Fed’s decision, they will start to reduce the $4.5 Trillion balance sheet as early as October by $10B/Monthly and will be increased every quarter up to $50B for the next 12 months.
This info is not new to the market, the Federal Reserve already outlined this plan in its meeting back in June of this year.
However, the trigger has led to a notable impact on the markets.
Rates To Rise One More Time

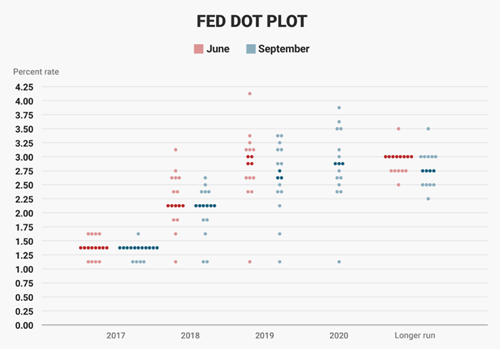
The majority of the FOMC participants expects one more rate hike before the end of the year, which might probably happen in December’s meeting.
The Fed Fund Futures are pricing in more than 60% chance for 25bps rate hike in December. At the same time there is more than 60% chance for three rate hike in 2018.
According to the dot plot, the Federal Reserve cuts the estimates of the longer-term natural rate to 2.75% down from 3.0% previously.
Economic Projections
For the current year, the Federal Reserve decided to increase the GDP growth forecast to 2.4% instead of 2.2%, left the unemployment rate estimates at 4.3%, but the most important factor is that they cuts the Core Inflation estimates to 1.5% instead of 1.7%.
For the year ahead, they kept the GDP estimates at 2.1%, cuts unemployment estimates to 4.1% from 4.2% and cuts the core inflation to 1.9% instead of 2.0%.
The Fed also showed its concerns about the reasons behind weaker inflation. Yellen also made it clear that they cant understand why inflation remains weak, which should be alarming.
What Does All This Means For USD

The US Dollar Index spiked across the board following the decision, reducing the balance sheet and the possibility for another rate hike in December are the main factors for yesterday’s rally.
However, the negative factors are the inflation estimates and the decline of the natural rate estimates.
Yet, today, we haven’t seen that big rally yet, in fact, during the European session, the US Dollar is still down by -0.15% trading around 92.30’s.
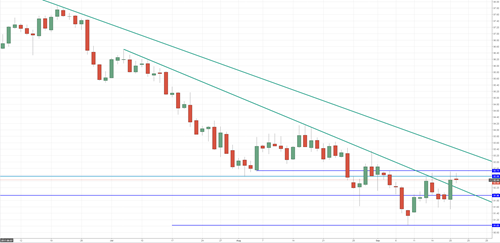
In the meantime, the US Dollar Index is still trading below its 92.50’s and 92.70’s key resistance area, which used to be a solid support back in 2016, 2015 and late 2014.
The weekly close needs to be watched very carefully, as only a weekly close above those levels would confirm the beginning of an upside retracement that could last for weeks.
Otherwise, if the US Dollar failed to close the week higher, this means that the downside trend is here to stay and likely to accelerate later next week.
On the downside view, the first immediate support remains at 92.0 followed by 91.0, which is the same area that the Dollar Index has been trading in since the end of August.
Edited by:
Nour Eldeen Al-Hammoury
Market Analyst
