USDCAD

Daily Wrap Up 11 March 2022
Optimistic sounds from Russia-Ukraine talks helps mood
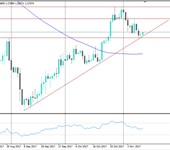
USDCAD 24 October
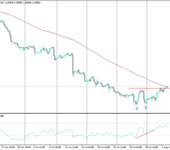
24 Oct 2017 01:56 PM |We can notice an inverted head and shoulders and prices managed to break the neckline,
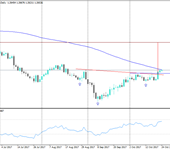
USDCAD 17 October
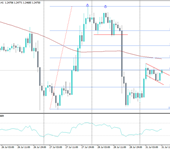
17 Oct 2017 03:41 PM |As we notice on daily chart, there is a head and shoulders forming, exceeding 1.26 would give us a buy signal targeting 1.28 then 1.2950. The pattern would be failed with breaking the support at 1.2430.
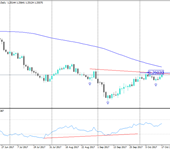
USDCAD 19 September
19 Sep 2017 02:20 PM |the pair currently in a downtrend, and we expect that prices to test levels of 1.2365/1.2450 before decline again targeting support levels of 1.2230 then 1.2060.

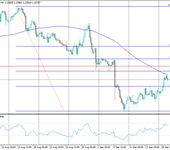
USDCAD 17 August
17 Aug 2017 11:09 AM |A double top pattern is formed and confirmed by breaking the neck line at 1.2650 targeting 1.2533.

USDCAD 7 August
7 Aug 2017 12:35 PM |The signal to enter buying USDCAD has confirmed after prices managed to break the neck line of double bottom pattern, so it would be targeting 1.2740. current support would be at 1.2630 then 1.2580.
USDCAD 3 August
3 Aug 2017 11:45 AM |As we mentioned yesterday about double bottom forming on 4 hours frame, after prices overcoming the neck line, we expect the pair to target 1.2740. support level would be at 1.2565 then 1.2530.

USDCAD 2 August
2 Aug 2017 01:05 PM |We can notice forming a double bottom on prices, besides the positive divergence on RSI, exceeding the barrier of 1.2575 would send prices higher to reach target of the pattern at 1.2740. current support would be at 1.2511 and 1.2415.
USDCAD 31 July
31 Jul 2017 12:33 PM |As we expected the pair reached its targets we mentioned before, we expect the pair to test 1.2485, and if it succeeded to exceed it we would see prices reach again to 1.2530. current support would be at 1.2450/10.
Prices may be delayed by 5 seconds. Prices above are subject to our website terms and conditions. Prices are indicative only


© 2023 Equiti, All Rights Reserved