Support
Bitcoin dominance explained: how BTC. D signals Altcoin market trends
Bitcoin’s dominance measures its percentage share of total cryptocurrency market capitalisation, reflecting broader risk appetite and capital rotations into altcoins during Altseasons. To interpret this metric accurately, structural market factors—such as stablecoin dilution, token proliferation, and spot Exchange-Traded Funds (ETFs)—should be carefully considered.
Bitcoin’s dominance measures its share of total cryptocurrency market capitalisation and reflects whether the market is adopting a relatively defensive stance or seeking greater risk.
Although Bitcoin typically exceeds 60% dominance, it has historically ceded its lead during Altseasons due to shifting market catalysts and capital flows.
Including stablecoins mathematically dilutes Bitcoin’s relative share, whilst the proliferation of new tokens fragments the capital available within the altcoin sector.
Since January 2024, SEC-approved spot ETFs have channelled institutional capital into Bitcoin, sustaining its dominance between 60% and 70%.
What is Bitcoin dominance and what does it mean?
Bitcoin dominance (commonly denoted as BTC.D) refers to the percentage measurement of how much Bitcoin’s market capitalisation represents relative to the total market capitalisation of the entire cryptocurrency sector. In other words, it seeks to analyse what proportion of the aggregate market value is held by Bitcoin versus the proportion represented by alternative cryptocurrencies (altcoins).
Why is Bitcoin dominance analysis relevant?
Bitcoin’s dominance reflects several critical dynamics within the cryptocurrency market, as it enables analysts to determine where the interest and capital of investors and long-term holders are concentrated.
One of its most relevant functions is serving as a barometer for general market sentiment. When institutional capital adopts a relative defensive stance, or when market participants prioritise liquidity, Bitcoin’s dominance tends to rise. Conversely, when risk appetite across the digital asset market increases, traders typically seek out more volatile assets with higher return potential, shifting their focus towards altcoins.
What is the influence of Bitcoin dominance on altcoin market trends?
Bitcoin’s dominance exerts a significant influence on the general trajectory of the altcoin market. One of the primary benefits of monitoring and analysing this metric is the ability to detect potential phases of capital rotation between Bitcoin and altcoins. Tracking these shifts makes it possible to identify emerging changes in investors' risk appetite, as well as the generalised behaviour of intrinsic market volatility.
How to compute Bitcoin dominance
The calculation of Bitcoin dominance represents a ratio between the market capitalisation of Bitcoin and the total market capitalisation of the cryptocurrency market. The formal formula is expressed as follows:
- Bitcoin Dominance = (Bitcoin market cap / Crypto total market cap) * 100
Consequently, the percentage representing the cumulative market capitalisation of altcoins is expressed as 1 - Bitcoin Dominance.
How to analyse market capitalisation on Bitcoin and altcoins
Because cryptocurrencies are listed and traded across fragmented, decentralised markets, no single centralised exchange ledger reflects Bitcoin’s dominance and historical behaviour in isolation. Instead, analysts rely on aggregated market data platforms. The chart below provides an example of how to analyse Bitcoin’s dominance over time via the TradingView platform.
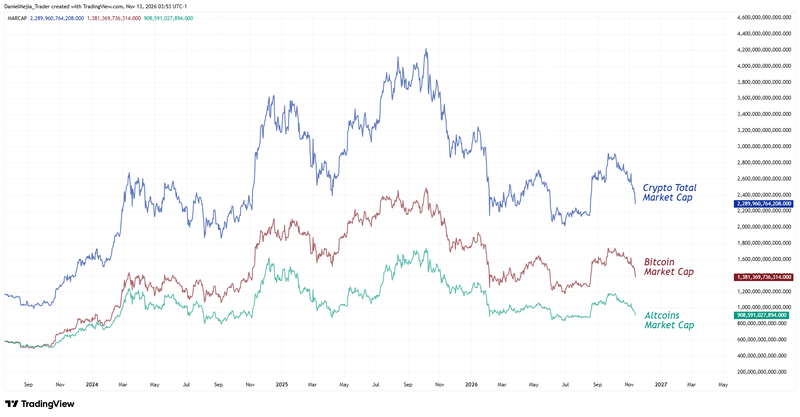
Figure 1. Bitcoin Dominance Analysis Across Time (2023–2026). Source: Figure retrieved from TradingView.
Is Bitcoin’s market cap above altcoins’ market cap all the time?
Bitcoin’s dominance does not remain permanently above the collective weighting of altcoins. Indeed, there have been distinct historical periods during which the aggregate market capitalisation of altcoins has surpassed that of Bitcoin. Such occurrences reflect a substantial transition of capital between the two asset classes, indicating that speculative risk appetite has increased considerably.
How has Bitcoin dominance performed over time?
While Bitcoin has maintained a leading position over altcoins for much of the industry's history, the intensity of its dominance has fluctuated significantly across different market cycles. For instance, between 2014 and early 2017, Bitcoin’s dominance consistently exceeded 95%. During 2017, however, this percentage gradually declined to below 50% (first Altseason). By mid-2018, Bitcoin’s dominance reclaimed the 50% threshold; subsequently, its average dominance remained above 60% until 2021, when altcoins once again managed to capture a larger market weighting.
Furthermore, from 2024 through to the end of 2026, Bitcoin has demonstrated sustained superiority in terms of market capitalisation, maintaining an average dominance within the 60% to 70% range. Notably, during this period, institutional inflows via spot Exchange-Traded Funds (ETFs) have reinforced market confidence and capital allocation towards Bitcoin, helping to anchor its elevated market share.
In which periods have Bitcoin’s market cap been lower than altcoins’ market cap and why?
The aggregate market capitalisation of altcoins exceeded that of Bitcoin during two primary historical periods: from November 2017 to June 2018, and from May 2021 to May 2023. In market parlance, these periods are widely referred to as Altseasons.
During the 2017–2018 cycle, several catalysts drove the rapid expansion of altcoins and eroded Bitcoin’s relative dominance. Foremost among these was the proliferation of new tokens via Initial Coin Offerings (ICOs), as investors sought opportunities offering higher percentage return potential than Bitcoin.
During the 2021–2023 cycle, the altcoin market underwent a renewed phase of expansion, primarily propelled by the growth of Decentralised Finance (DeFi) and heightened interest from both retail and institutional participants. Within this environment, alternative networks such as Solana and Cardano gained substantial traction and captured significant market attention.
Concurrently, the expansionary monetary policies and fiscal stimulus packages implemented by governments globally during the COVID-19 pandemic fostered an environment of abundant liquidity and elevated appetite for risk assets, further accelerating capital inflows into the broader cryptocurrency market.
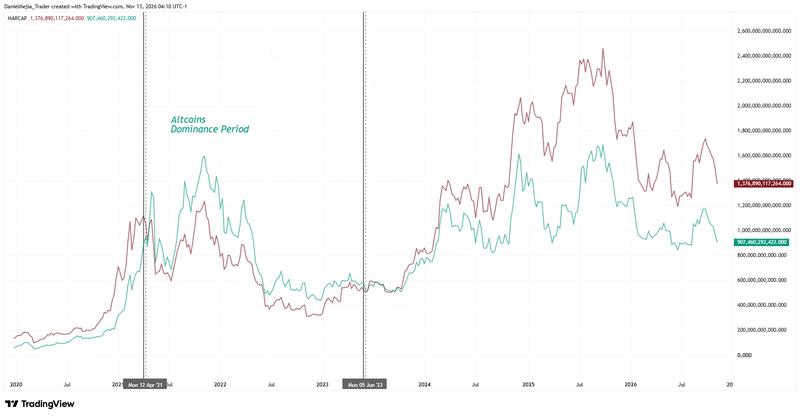
Figure 1. Bitcoin Dominance Analysis Across Time (2023–2026). Source: Figure retrieved from TradingView.
Structural factors in digital assets impacting Bitcoin dominance
Beyond cyclical sentiment, several structural dynamics within the cryptocurrency ecosystem should be evaluated when interpreting Bitcoin’s dominance. Among the most consequential are the mathematical dilution caused by stablecoins, the proliferation of new tokens, and institutional capital allocation towards Bitcoin.
Mathematical dilution from stablecoins
It is essential to distinguish whether a given Bitcoin dominance index includes or excludes stablecoins within the total cryptocurrency market capitalisation, as their inclusion introduces a mathematical dilution of Bitcoin’s relative share that can distort analytical conclusions.
Many financial analytics and market data platforms incorporate stablecoins into the aggregate market capitalisation figure. Doing so mechanically reduces Bitcoin’s percentage dominance without any actual rotation of capital into speculative altcoins having occurred. For example, if Bitcoin accounts for 55% of total market capitalisation and stablecoins represent 5%, excluding stablecoins from the denominator raises Bitcoin’s adjusted dominance to approximately 57.89%.
Consequently, it is advisable to complement standard BTC.D readings with market capitalisation metrics that exclude stablecoins. Doing so allows analysts to evaluate Bitcoin’s relative share specifically against variable-price crypto assets (altcoins), yielding a more accurate interpretation of genuine capital movements within the market.
Token proliferation
The creation of new tokens has intensified markedly as an ever-growing number of projects seek funding and compete for available liquidity within the cryptocurrency market. This phenomenon leads to pronounced capital fragmentation, as investment flows are dispersed across an expanding array of digital assets.
As a result, whenever the inflow of fresh capital into the sector fails to keep pace with the expanding supply of new tokens, it becomes substantially more difficult for the altcoin market to sustain a broad-based uptrend. This structural dilution acts as a persistent headwind, limiting the altcoin sector's capacity to expand its cumulative market capitalisation and capture relative share from Bitcoin.
Institutional investment via Bitcoin spot ETFs
Following the approval of Bitcoin spot ETFs by the US Securities and Exchange Commission (SEC) in January 2024, institutional investors gained streamlined access to the cryptocurrency market through regulated financial instruments available via traditional brokerage and wealth management channels.
However, this wave of institutional participation has remained heavily concentrated in Bitcoin, driven by its superior market capitalisation, deep liquidity, established track record, and the availability of regulated investment vehicles. Conversely, a considerable proportion of altcoins face significant hurdles in meeting strict institutional compliance and liquidity criteria, structurally reinforcing Bitcoin’s dominance over its market competitors.
Conclusion
Ultimately, Bitcoin’s dominance constitutes a vital analytical tool for assessing cryptocurrency market sentiment and anticipating potential capital rotations into altcoins. Whilst historical precedent demonstrates that Altseasons can temporarily compress its lead, the performance observed underscores Bitcoin’s structural resilience. To conduct a rigorous assessment, market participants should complement traditional BTC.D readings by accounting for the impact of institutional spot ETFs, token proliferation, and the mathematical dilution introduced by stablecoins.
If you're interested in trading indices, foreign exchange, shares, or commodities, consider exploring the CFD contracts offered by Equiti Group. Please note that trading leveraged derivatives involves a high level of risk and may not be suitable for all investors.
FAQs
What is Bitcoin dominance (BTC.D) and how is it calculated?
Bitcoin dominance is the percentage representing Bitcoin’s market capitalisation relative to the total cryptocurrency market cap. It is calculated by dividing Bitcoin’s market cap by the total cryptocurrency market cap and multiplying the result by 100.
How does Bitcoin’s dominance anticipate altcoin market trends?
Monitoring BTC.D makes it possible to detect phases of capital rotation and shifts in broader risk appetite. When investors adopt a more defensive posture or seek liquidity, Bitcoin’s dominance tends to increase. Conversely, when risk tolerance and the pursuit of higher potential returns grow, capital flows into more volatile assets such as altcoins, driving periods of expansion known as Altseasons.
Why can stablecoins distort Bitcoin’s dominance reading?
When analytics platforms include stablecoins within the total cryptocurrency market capitalisation, a mathematical dilution occurs in Bitcoin’s dominance percentage without any genuine rotation of capital into speculative cryptoassets taking place. For example, if Bitcoin accounts for 55% of the total market and stablecoins account for 5%, excluding stablecoins raises Bitcoin’s adjusted dominance to 57.89%. Therefore, it is advisable to complement the traditional indicator with metrics that exclude stablecoins to accurately assess the relationship between Bitcoin and altcoins.