
 Support
 Bitcoin falls as persistent Middle East tensions threaten energy supply chains
Bitcoin dropped as Middle East energy supply disruptions drove up Brent crude prices and US Treasury yields, fuelling expectations of further Federal Reserve rate hikes.

Brent crude surpassed the $100 per barrel threshold, intensifying global inflationary fears.
Benchmark 10-year US Treasury yields climbed above 5.30%, reinforcing expectations of a tighter monetary policy stance.
Institutional investors could be reallocating capital away from risk-on cryptocurrencies and into higher-yielding fixed-income assets amidst an environment of rising interest rates.
Date: 8 October 2026
Why is Bitcoin falling as Middle East tensions threaten energy supply chains?
Bitcoin fell by 2.74% to $83,190 amid persistent inflationary pressures that continue to drive restrictive monetary policy stances across global central banks, particularly the Federal Reserve in the US.
Against this backdrop, geopolitical escalation remains closely linked to inflationary pressures, as the conflict between the US and Iran in the Middle East weighs heavily on global energy supply chains. Although crude oil transit through the Strait of Hormuz has returned close to levels observed prior to the onset of conflict on 28 February, persistent attacks on commercial oil tankers continue to concern market participants, given that any further escalation could trigger severe supply chain deterioration.
In this context, recent Iranian attacks on oil tankers over recent hours pushed Brent crude prices above the $100 threshold, with the benchmark trading around $102 per barrel during today's session.
Following these geopolitical developments, benchmark 10-year US Treasury yields advanced above 5.30% amidst rising market expectations that the Federal Reserve will adopt a more restrictive monetary policy stance. Furthermore, the minutes from the latest Federal Open Market Committee (FOMC) meeting revealed that central bank officials anticipate an additional interest rate hike before the end of 2026, though they did not specify at which upcoming meeting this action might occur.
Consequently, the CME FedWatch Tool reflects an 81% market-implied probability that the Federal Reserve will hold interest rates steady in October, while pricing in a 66% probability of a 25-basis-point rate increase at the December meeting.
An environment characterised by elevated interest rates enhances the relative attractiveness of US Treasury securities, as they offer higher risk-adjusted returns. This dynamic typically prompts capital reallocations away from risk assets, such as cryptocurrencies, towards US fixed-income markets, particularly amongst institutional investors.
Technical analysis of Bitcoin
From a technical perspective, Bitcoin remains within a consolidation range, although short-term price action demonstrates robust bullish momentum. A detailed examination of the current market structure reveals several key technical observations:
- Trend Context: On daily timeframes, Bitcoin has reclaimed its 50-day, 100-day, and 200-day Simple Moving Averages (SMAs), reflecting renewed buying pressure over recent weeks. Currently, price action is testing short-term structural support, suggesting a continuation of the upward trajectory if this level holds.
- Resistance Levels: Should the Volume Profile’s Value Area High (VAH) at $87,864 be breached to the upside, the next key technical resistance zone lies near $96,300. A sustained close above these levels would increase the probability of Bitcoin advancing towards higher valuation levels.
- Support Levels: If short-term structural support at $82,500 breaks to the downside, two primary support zones emerge: $78,664 (the Volume Profile’s Point of Control) and $72,000 (a level that converges with the 200-day SMA). A sustained breakdown below these levels would heighten the likelihood of a deeper correction.
- Momentum Indicators: The Moving Average Convergence Divergence (MACD) displays a bearish divergence, pointing to a potential short-term market retracement or consolidation phase. Concurrently, the Relative Strength Index (RSI) indicates a downward trajectory from near-overbought territory, reinforcing the probability that a short-term pullback may occur.
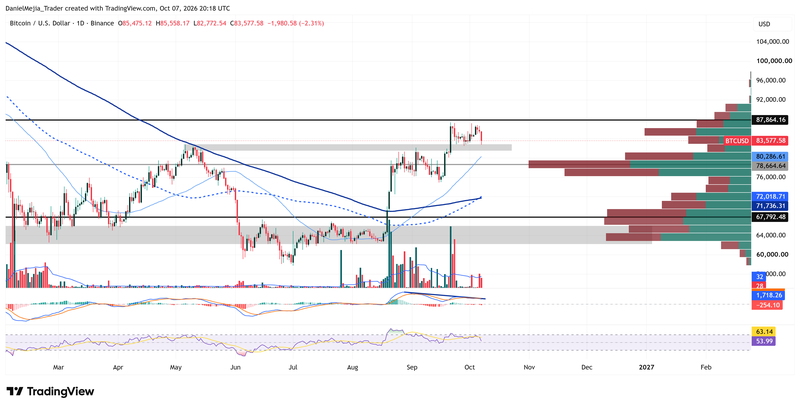
Figure 1. Bitcoin’s Price (2025–2026). Source: Data from Binance Exchange; author's analysis conducted via TradingView.


