
 Support
 Bitcoin rallies above $85,000 as market momentum strengthens
Bitcoin rallied 6.64% to $86,562, driven by easing inflationary pressures, following a decline in oil prices and expanding institutional integration through the European Central Bank’s adoption of blockchain technology.

Bitcoin surged by 6.64% to $86,562, supported by reduced inflationary pressures and falling oil prices.
Additionally, the European Central Bank (ECB) launched a payment service connecting blockchain technology with financial markets, bolstering institutional confidence.
In this context, cryptocurrency traders are assigning less weight to Federal Reserve rate-hike risks than in previous months.
Date: 22 September 2026
What is driving Bitcoin’s strong price momentum?
Bitcoin prices jumped by 6.64% to $86,562 amidst a renewed appetite for risk assets. Over the past week, Bitcoin has appreciated by approximately 12%.
This performance was primarily driven by easing inflationary pressures alongside a daily decline in oil prices. At market close, the Brent futures contract (BRNX6) dropped by 3.40% to $100.34 per barrel, whilst the West Texas Intermediate (WTI) futures contract (CLX6) declined by 3.82% to $92.38 per barrel. Concurrently, the 10-year US Treasury bond yield fell by 4.9 basis points to 4.95%.
However, despite the weakness in oil prices, market expectations continue to signal a potential interest-rate hike from the Federal Reserve. According to the CME FedWatch Tool, market-implied probability indicates a 56.5% likelihood that the US central bank will raise its benchmark interest rate by 25 basis points at its October meeting.
Higher interest rate environments typically exert downward pressure on Bitcoin, as investors rotate away from cryptocurrencies in search of a more favourable risk-reward profile in government bonds, such as Treasury yields. Nevertheless, cryptocurrency traders currently appear to be assigning less weight to the Federal Reserve’s restrictive monetary policy stance than in previous months, when it weighed heavily on crypto valuations.
Additionally, the cryptocurrency market could be benefiting from regulatory and institutional developments that enhance investor confidence. According to a Reuters report, the European Central Bank (ECB) has launched a new service linking its payment infrastructure with blockchain-based financial markets. Notably, the ECB highlighted that this technology possesses the potential to make transactions faster and more efficient.
Against this backdrop, whilst this development does not indicate that the ECB intends to invest directly in cryptocurrencies, the underlying signal is clear, regarding to blockchain technology is acquiring greater relevance within the international financial system, further bridging the gap between digital assets and traditional finance.
Technical analysis of Bitcoin
From a technical perspective, Bitcoin remains within a consolidation range, although short-term price action demonstrates robust bullish momentum. A detailed examination of the current market structure reveals several key technical observations:
- Trend Context: On daily timeframes, Bitcoin has reclaimed its 50-day, 100-day, and 200-day Simple Moving Averages (SMAs), reflecting renewed buying pressure over the last weeks. Currently, price action is testing a significant resistance zone, which could either reinforce bullish momentum if breached or trigger a rejection if macroeconomic and regulatory fundamentals fail to support the asset.
- Resistance Levels: Should structural resistance at $86,295 be decisively breached to the upside, the next key technical zone lies near $95,500. A sustained close above these levels would effectively invalidate the broader downtrend structure and signal potential for a wider structural recovery.
- Support Levels: In the event of a retracement, primary structural support sits at $81,500, followed by a secondary technical floor near $75,000. A sustained breakdown below these levels would significantly increase the probability of a deeper correction.
- Momentum Indicators: Both the Moving Average Convergence Divergence (MACD) and the Relative Strength Index (RSI) display upward trajectories, suggesting that short-term bullish momentum could persist. However, the RSI is currently trading in overbought territory, signalling caution regarding the underlying impulse. Nevertheless, macroeconomic developments and regulatory catalysts are expected to remain the primary drivers of directional bias.
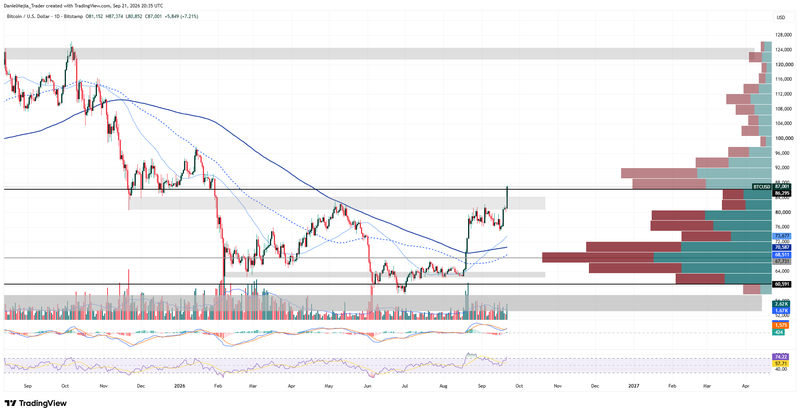
Figure 1. Bitcoin’s Price (2025–2026). Source: Analysis conducted via TradingView.


