
 Support
 Cardano maintains its uptrend despite a pause in Altcoin market cap growth
Cardano continues to outpace major cryptocurrencies with an approximate 75% gain, sustaining a short-term bullish channel pattern even as broader macroeconomic headwinds present ongoing sector risks.
Cardano has appreciated by approximately 75% since July, outperforming major digital assets including Bitcoin and Ethereum.
Persistent macroeconomic uncertainty and elevated government bond yields continue to present structural headwinds for the broader cryptocurrency market.
Lower volatility in Bitcoin reflects expanding institutional adoption via spot exchange-traded funds (ETFs), whereas Cardano's higher volatility continues to attract traders seeking greater upside potential.
Date: 7 October 2026
Can Cardano sustain its uptrend despite slowing Altcoin market growth?
Cardano's price performance has been robust, outpacing the cumulative returns of mega-cap cryptocurrencies such as Ethereum, Solana, and Bitcoin. Since reaching its trough in early July, Cardano has recorded an appreciation of approximately 75%, compared with Ethereum (+66%), Solana (+65%), and Bitcoin (+39%). This upward trajectory has been accompanied and reinforced by a well-structured, short-term bullish channel pattern.
Against this backdrop, Cardano continues to advance within an ascending technical structure, even as total altcoin market capitalisation has experienced a brief two-week consolidation phase. This relative resilience may be attributed to Cardano's lower nominal unit price (trading in US cents), which renders it more sensitive to percentage price movements. Consequently, crypto traders may perceive a more favourable risk-reward profile compared with higher-priced digital assets.
Conversely, Bitcoin has exhibited greater price stability, gaining 39% over the past three months. This reduced volatility reflects expanding institutional participation facilitated by spot Exchange-Traded Funds (ETFs), which cater to investors seeking lower-risk cryptocurrency exposure.
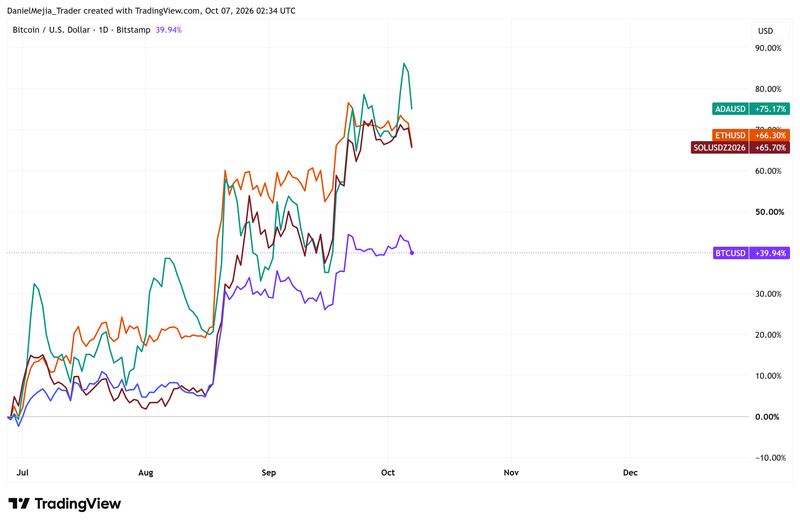
Figure 1. Comparison of Cardano, Ethereum, Solana, and Bitcoin (Last Three Months). Source: Data from Binance, Coinbase, and Bitstamp exchanges; author's analysis conducted via TradingView.
Consequently, while Cardano's technical trajectory remains positive, its sustained momentum relies heavily on broader market sentiment within a complex digital asset environment. In this context, global macroeconomic and geopolitical friction is prompting central banks to maintain restrictive monetary policy stances to curb inflationary pressures. Higher interest rates and elevated government bond yields increase the opportunity cost of holding non-yielding digital assets, creating persistent headwinds for the sector.
Technical analysis of Cardano
From a technical standpoint, Cardano has maintained an ascending trajectory over the past three months. Key technical observations include:
- Trend context: Over the three-month period, Cardano has established a bullish market structure characterised by higher highs and higher lows. Furthermore, the asset is trading above its 50-day, 100-day, and 200-day Simple Moving Averages (SMAs), reinforcing a short-term bullish bias. However, price action is currently testing a robust resistance zone, where a structural technical ceiling converges with the upper boundary of the bullish channel and the Volume Profile's Value Area High (VAH).
- Resistance levels: Should Cardano breach the immediate resistance level near $0.26 to the upside, the next major technical barrier is situated at $0.30, followed by secondary resistance at $0.40. A decisive breakout above these key levels would increase the probability of upward revaluation.
- Support levels: In the event of a market retracement, two significant support levels are established at $0.24 and $0.214—the latter representing a key technical confluence between the lower boundary of the bullish channel and the 200-day SMA. A sustained breakdown below these support zones would heighten the risk of a broader downside correction.
- Momentum indicators: The Moving Average Convergence Divergence (MACD) continues to trend upward, suggesting that short-term momentum could continue. Conversely, the Relative Strength Index (RSI) is trading near overbought territory, signalling caution regarding potential short-term momentum exhaustion.
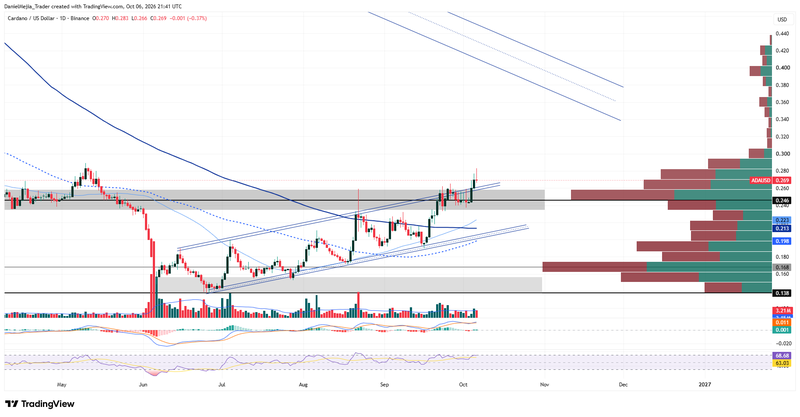
Figure 2. Cardano Price Chart (2025–2026). Source: Data from Binance exchange; author's analysis conducted via TradingView.


