Support
Cardano nears critical support as financial market volatility intensifies
Cardano has encountered significant selling pressure, driven by rising energy prices, mounting inflationary concerns, and anticipated Federal Reserve (Fed) interest rate hikes that continue to weigh on high-risk assets.
Cardano fell by 6.15% to $0.212 following broader liquidations in US equities, prompted by concerns surrounding artificial intelligence valuations and rising crude oil prices.
Brent crude surged to $113.15 per barrel, heightening global inflationary pressures and increasing the likelihood of Fed's rate hikes.
The $0.211 support level converges with the 100-day and 200-day Simple Moving Averages, serving as a critical technical floor.
Date: 23 October 2026 (GMT+3)
Is Cardano's key support level at risk amid financial market turbulence?
Cardano's price contracted sharply by 6.15% to $0.212 amidst widespread instability across US financial markets. Consequently, persistent selling pressure has driven the cryptocurrency down towards a critical support zone within its broader price action structure.
Against this backdrop, digital assets have experienced a negative market sentiment from US equity markets, which suffered sharp declines following renewed concerns regarding artificial intelligence (AI) security and elevated market valuations. Equities and digital assets typically display high correlation during bearish market regimes, as both asset classes are categorised as high-risk investments. As volatility escalates, market participants tend to seek shelter in more defensive or safe-haven assets.
Concurrently, ongoing tensions in the Middle East involving the Houthi movement and Saudi Arabia have propelled energy prices to multi-month highs. At the market close, the Brent crude futures contract (BRN) jumped by 4.00% to $113.15 per barrel, fuelled by escalating fears of further regional energy supply disruptions.
Sustained increases in energy prices are generating intensified inflationary pressures worldwide, forcing influential central banks to adopt more restrictive monetary policy stances. Specifically, the CME FedWatch Tool currently indicates a 75% probability that the Federal Reserve will raise its benchmark interest rate by 25 basis points. This outlook has exerted additional downward pressure on digital assets, as rising US Treasury yields offer investors with more attractive risk-adjusted returns elsewhere.
Technical analysis of Cardano
From a technical perspective, Cardano has maintained an ascending trajectory over the past four months. Key observations include:
- Trend context: Over this four-month timeframe, Cardano established a bullish market structure defined by higher highs and higher lows within an ascending technical channel. Furthermore, the asset continues to trade above its 100-day and 200-day Simple Moving Averages (SMAs), reinforcing its short-term bullish bias. However, following around two consecutive weeks of selling pressure, price action is currently testing a crucial support area where the lower boundary of the ascending channel converges with both the 100-day and 200-day SMAs at $0.211.
- Momentum indicators: Both the Moving Average Convergence Divergence (MACD) and the Relative Strength Index (RSI) are trending downwards, suggesting that short-term bearish pressure may persist. Nonetheless, the surrounding price action structure continues to represent a significant technical floor.
- Resistance levels: Should the $0.211 support level hold firm and catalyse an upward rebound, the primary technical barrier is situated at $0.230, followed by secondary resistance at $0.246—a level that coincides with a major structural resistance zone.
- Support levels: Conversely, if short-term selling pressure persists and breaches the $0.211 support level, the next key support area lies at $0.192. Below this, secondary support is located at $0.165, which aligns with the Volume Profile's Point of Control (POC).
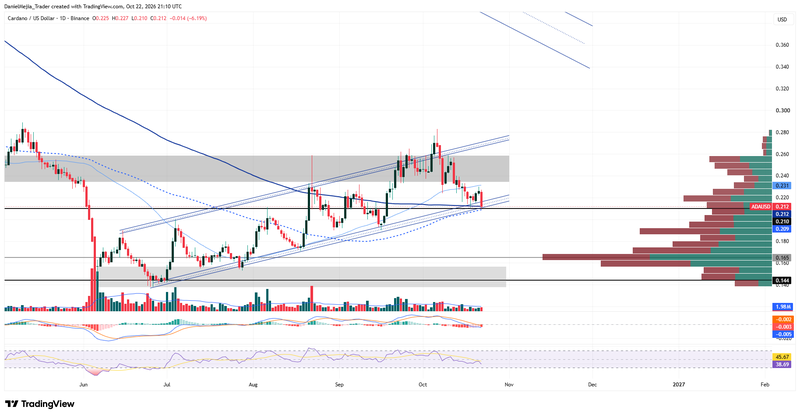
Figure 1. Cardano Price Chart (2025–2026). Source: Data from Binance exchange; author's analysis conducted via TradingView.