Support
 Ethereum declines amid rising geopolitical tensions in the Middle East
Ethereum fell 1.94% as escalating US–Iran tensions and the closure of the Strait of Hormuz weakened global risk appetite. Despite the prevailing bearish price action, underlying technical indicators suggest potential recovery momentum may be building.

Ethereum declined 1.94% to $1,765 as intensifying Middle East conflicts dampened investor appetite for high-risk assets.
The United States terminated its ceasefire with Iran, while disputes over the strategic Strait of Hormuz heightened global market uncertainty.
Although Ether remains pinned below its key 100-day and 200-day moving averages, a bullish MACD divergence hints at a potential short-term rebound.
Ethereum comes under pressure as geopolitical risks escalate in the Middle East
Ethereum fell by 1.94% to settle at $1,765 by the close of trade, adversely affected by escalating geopolitical tensions in the Middle East. Following a weekend of military skirmishes between Washington and Tehran, Iranian officials declared the closure of the Strait of Hormuz—a critical maritime chokepoint through which a significant portion of the global energy supply chain transits. Concurrently, the US announced the termination of the bilateral ceasefire agreement between the two nations.
According to reports from Reuters, US President Donald Trump stated that Washington is reinstating its blockade of Iranian shipping in the Gulf. Writing on Truth Social, the US President declared: “The Hormuz Strait is open and will remain open with or without Iran.” In response, Iranian Foreign Minister Abbas Araqchi countered that “Tehran was the guardian of the Strait and would remain so forever”.
Consequently, this environment of geopolitical instability has impacted cryptocurrency market sentiment, typically weakening risk appetite. However, Ethereum’s price action signals a stark divergence between macro-driven, risk-off sentiment and underlying technical indicators pointing to a potential short-term recovery.
Technical analysis of Ethereum
From a technical perspective, Ethereum maintains a well-defined downward trajectory over an extended timeframe. A detailed assessment of the current market structure reveals several key observations:
- Trend Context: Ethereum continues to exhibit a broader downward bias, with the spot price trading comfortably below its 100-day and 200-day Simple Moving Averages (SMAs). This alignment reinforces the multi-month structure of lower highs and lower lows. However, while the overarching trend remains trapped within this bearish regime, short-term momentum oscillators are beginning to construct an ascending profile.
- Resistance Levels: Should immediate psychological resistance near the $2,000 threshold be decisively breached to the upside, the primary technical ceiling is identified at $2,380. Reclaiming this structural pivot point would be an essential prerequisite for market bulls to re-establish sustained upward momentum.
- Support Levels: If the long-term structural support at $1,500 is invalidated, the next critical floor rests at the $1,000 mark—a psychological boundary of immense significance. A sustained close below this threshold would likely intensify liquidation pressure and significantly increase the probability of a deeper, prolonged market correction.
- Momentum Indicators: The Moving Average Convergence Divergence (MACD) indicator exhibits a distinct bullish divergence against price action, implying that a near-term price recovery may be materialising. Simultaneously, the Relative Strength Index (RSI) is tracking an upward trajectory out of lower boundaries, suggesting that underlying buying momentum could re-emerge. Nevertheless, near-term price discovery will remain heavily dependent on how these fluid macroeconomic and geopolitical developments unfold.
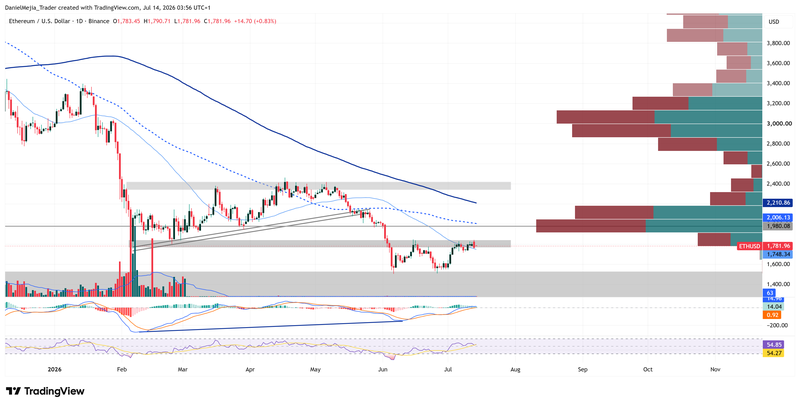
Figure 1. Ethereum Prices (2025–2026). Source: Data from the Binance Exchange; own analysis conducted via TradingView.