Support
 Ethereum declines as expectations of higher Fed interest rates intensify
Ethereum has dipped as an escalation in the US–Iran conflict drove oil prices higher, heightening inflation fears. Consequently, market expectations of a Federal Reserve interest rate hike rose to 67%, exerting downward pressure on cryptocurrency assets despite recent short-term bullish momentum.

A 67% market probability of a September Fed rate hike diminished investor risk appetite for Ethereum.
The escalating US–Iran conflict threatens energy supplies, driving up crude oil prices and elevating US inflationary risks.
Ethereum maintains a short-term bullish impulse, although momentum indicators are trading in overbought territory, signalling a potential retracement or consolidation phase.
Date: 1 September 2026
How Fed interest rate hike expectations impact Ethereum prices
Ethereum prices exhibited a slight depreciation following a significant re-escalation in the US–Iran conflict. According to reports from Reuters, the US launched fresh airstrikes on Iranian territory, triggering a sharp escalation in the conflict and heightening concerns over further energy supply disruptions. In response, Iranian officials warned that Tehran would attempt to block oil exports from the Persian Gulf, which could intensify inflationary pressures in the US as market participants digest the potential ramifications of a prolonged conflict.
Consequently, data from the CME FedWatch Tool indicates that the market-implied probability of an interest rate hike at the September Fed meeting has risen to 67%, reducing the likelihood of rates remaining unchanged to 33%. This underscores how closely market participants monitor geopolitical developments due to their direct impact on monetary policy expectations.
Cryptocurrencies typically underperform in an environment of higher interest rates from the Federal Reserve (Fed), as government bonds offer lower risk and become increasingly attractive to investors. In this context, ongoing geopolitical tensions between the United States and Iran in the Middle East are placing upward pressure on crude oil prices, thereby elevating inflation expectations and increasing the likelihood of the Fed implementing interest rate hikes to contain prices.
However, despite these headwinds, Ethereum prices retain substantial appreciation, having breached prominent resistance levels during recent price action. The digital asset has accumulated gains of approximately 29% over the past two weeks, with current price action undergoing a pullback to test a key technical pivot zone.
Technical analysis of Ethereum
From a technical perspective, Ethereum is exhibiting a strong impulse in its short-term performance. A detailed assessment of the current market structure reveals several key observations:
- Trend Context: Ethereum signals robust short-term bullish momentum, trading above its 50-day, 100-day, and 200-day Simple Moving Averages (SMAs). Notably, the price is testing a critical support level that could serve as a technical floor if maintained as a key pivot zone.
- Resistance Levels: Should the current bullish impulse persist, the primary technical ceiling lies at the $3,000 level—a major psychological barrier. A decisive breach above this threshold could imply a potential upward momentum, where the next prominent resistance zone is $3,270.
- Support Levels: In the event of a market retracement, the next critical floor is located at the $2,000 mark—a highly significant psychological boundary that converges with the 200-day SMA. A sustained close below this threshold would likely intensify liquidation pressure, significantly increasing the probability of a deeper correction towards structural support at $1,800.
- Momentum Indicators: Both the Moving Average Convergence Divergence (MACD) and the Relative Strength Index (RSI) are trading in overbought territory, signalling a potential price retracement or consolidation phase in the short term. Nevertheless, it is possible that price performance could remain heavily dependent on the broader macroeconomic and geopolitical background.
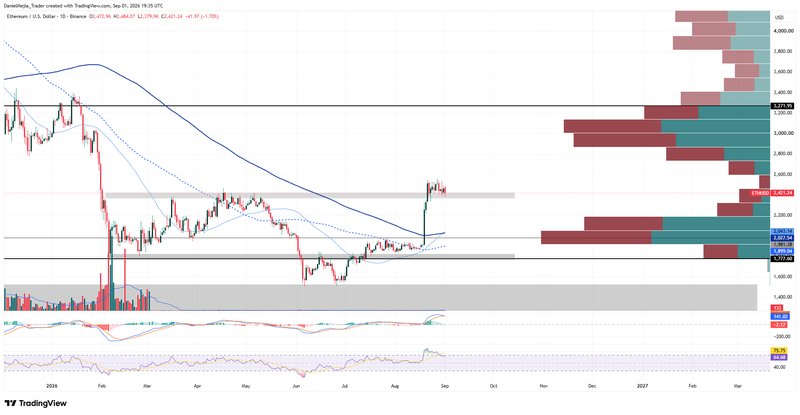
Figure 1. Ethereum Price (2025–2026). Source: Data from Binance Exchange; author’s analysis conducted via TradingView.