Ethereum nears the $1,500 level amid rising expectations of a more hawkish Fed
Ethereum fell by 2.43% to $1,573 as hotter US PCE inflation strengthened expectations of further Federal Reserve tightening, pressuring risk assets and lifting crypto volatility. Markets are increasingly pricing in rate hikes through year-end, while Ether approaches the critical $1,500 support level.

Ether fell by 2.43% to $1,573 as stronger PCE inflation reinforced expectations of tighter Federal Reserve policy and weakened risk appetite.
Fed rate-hike expectations rose sharply, with markets pricing in at least one increase by the September, October, or December meetings.
Ethereum implied volatility jumped by 4.29% to 64.93, signalling greater expected price swings as macroeconomic pressures intensify.
Ethereum approaches $1,500 as hawkish Fed expectations intensify
Ethereum prices declined by 2.43% to $1,573, thereby moving closer to the $1,500 threshold, which could imply a further contraction if breached to the downside. Current selling pressure has been driven by rising expectations that the Federal Reserve (Fed) could implement more restrictive measures in the coming months, creating a sell-off environment for high-risk assets such as cryptocurrencies.
According to data from the US Bureau of Economic Analysis (BEA), the PCE Price Index accelerated from 3.8% in April to 4.1% in May on a year-on-year basis, in line with market expectations. This represents the highest level since April 2023, increasing pressure on the Fed in its efforts to contain inflation.
Consequently, market participants have increasingly priced in the prospect of further monetary tightening at forthcoming Federal Reserve meetings. Data from CME’s FedWatch Tool indicate a 48.5% probability of a 25-basis-point rate hike in September, alongside a 14.7% likelihood of a 50-basis-point increase. For subsequent meetings, markets assign a 71.7% probability of at least one rate hike by October, rising to 81.5% by December.
Furthermore, the Ethereum Volmex Implied Volatility (EVIV) index increased by 4.29% to 64.93, pointing to a marked rise in expected market volatility. As a measure of 30-day implied volatility derived from Ethereum options, a higher EVIV reading generally reflects elevated uncertainty, with price movements becoming more pronounced.
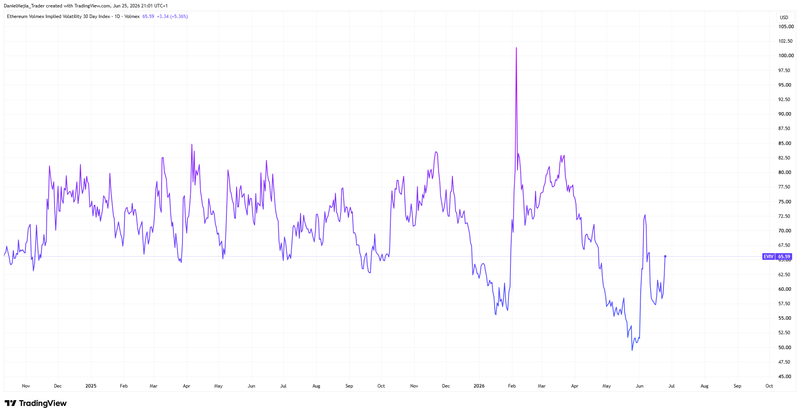
Figure 1. Ethereum Volmex Implied Volatility (2024–2026). Source: Figure obtained from TradingView.
Technical analysis of Ethereum
From a technical perspective, Ethereum maintains a clear downward trajectory. A more detailed assessment of the current market structure reveals several key observations:
- Resistance levels: Should the immediate psychological resistance near the $2,000 threshold be breached to the upside, the primary technical ceiling is identified at $2,380. Reclaiming this structural pivot point would be relevant for recovering upward momentum.
- Support levels: If the long-term structural support at $1,500 is breached, the next critical floor lies at the $1,000 mark—a prominent psychological zone. A sustained close below this threshold would likely intensify selling pressure and significantly increase the probability of a deeper market correction.
- Momentum indicators: The Moving Average Convergence Divergence (MACD) indicates a bullish divergence, implying a possible short-term recovery in price. At the same time, the Relative Strength Index (RSI) is hovering close to oversold levels, signalling that bullish momentum may re-emerge. Nevertheless, macroeconomic and geopolitical developments are expected to continue shaping Ethereum’s forward path.
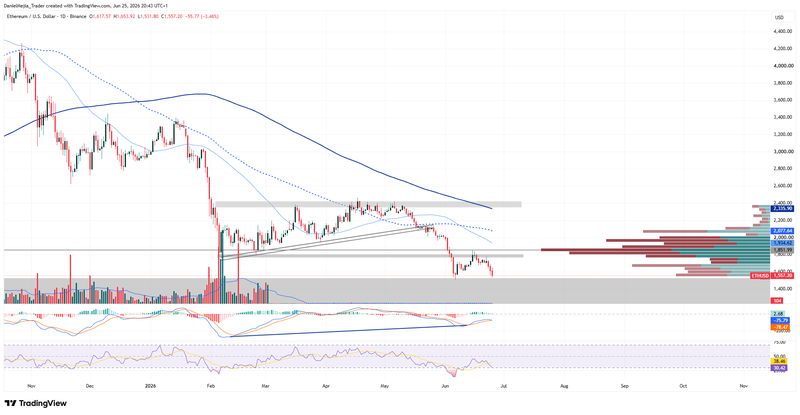
Figure 2. Ethereum Prices (2025–2026). Source: Data from the Binance Exchange; own analysis conducted via TradingView.


