Ethereum slides toward key support on heightened geopolitical risks
Ethereum rebounded by 8% to $1,693, but remained under pressure near the key $1,500 support level as tensions in the Middle East, supply disruptions, and inflation concerns weakened risk appetite. In addition, strong US payroll data reinforced expectations of higher-for-longer Federal Reserve policy, contributing to increased volatility.

Ethereum rose 8% to $1,693, but price action remains fragile as it tests long-term support near the critical $1,500 zone.
Israeli and Iranian strikes fuelled inflation and supply concerns, reducing appetite for risk assets and increasing selling pressure on cryptocurrencies.
Strong US payroll data lifted expectations of further Fed tightening, while Ethereum implied volatility rose by 26% over the past week.
Ethereum under pressure at key support amid geopolitical uncertainty
Ethereum closed today’s trading session with a recovery, testing a key long-term structural support level. The cryptocurrency rose by 8% to $1,693. The crypto market has been affected by rising geopolitical tensions in the Middle East, which have caused several disruptions to energy supply chains and, consequently, heightened inflationary pressures. This environment has reduced appetite for riskier assets and increased selling pressure across digital assets.
Regarding the latest developments, Reuters reported that Israel struck an Iranian petrochemical facility over the weekend, which it said was involved in the production of ballistic missiles. In turn, Iran responded with missile attacks targeting Israeli sites, further intensifying concerns about a broader regional conflict. Bilateral strikes across Israeli, Iranian, and Lebanese territories have renewed fears that the conflict could re-escalate or persist.
In addition, the Bureau of Labor Statistics (BLS) released a strong employment report last Friday, most notably showing non-farm payrolls above expectations, suggesting that interest rate cuts from the Federal Reserve may not be required. According to CME’s FedWatch Tool, market-implied probabilities indicate that an interest rate increase at the December meeting remains the most likely outcome. For the October meeting, the tool shows a 42% probability of a rate hike.
Consequently, the Ethereum Volmex Implied Volatility (EVIV) Index has risen by 26% over the past week. This index, similar to the VIX, reflects how markets price implied volatility in cryptocurrencies, particularly Ethereum.
Thus, Ethereum’s current technical position highlights a prominent structural support area at $1,500, which could either serve as a significant floor or open the way to a further market contraction.
Technical analysis of Ethereum
From a technical perspective, Ethereum maintains a clear downward trajectory. A more detailed assessment of the current market structure reveals several key observations:
- Trend context: Within a long-term framework, Ethereum continues to trade below its 50-day, 100-day, and 200-day Simple Moving Averages (SMAs). This sustained position beneath major moving averages reinforces the prevailing bearish sentiment.
- Resistance levels: Should the immediate psychological resistance near the $2,000 threshold be breached to the upside, the primary technical ceiling is identified at $2,380. Reclaiming this structural pivot point would be a prerequisite for re-establishing a sustained bullish trend.
- Support levels: If the long-term structural support at $1,500 is breached, the next critical floor lies at the $1,000 mark—a prominent psychological zone. A sustained close below this threshold would likely intensify selling pressure and significantly increase the probability of a deeper market correction.
- Momentum indicators: The Moving Average Convergence Divergence (MACD) indicator is currently following a downward slope, suggesting that bearish forces remain in control of price action. Conversely, the Relative Strength Index (RSI) is trading deep in oversold territory, indicating that although the trend remains strongly bearish, traders should exercise near-term caution regarding potential oversold rebounds or a price recovery.
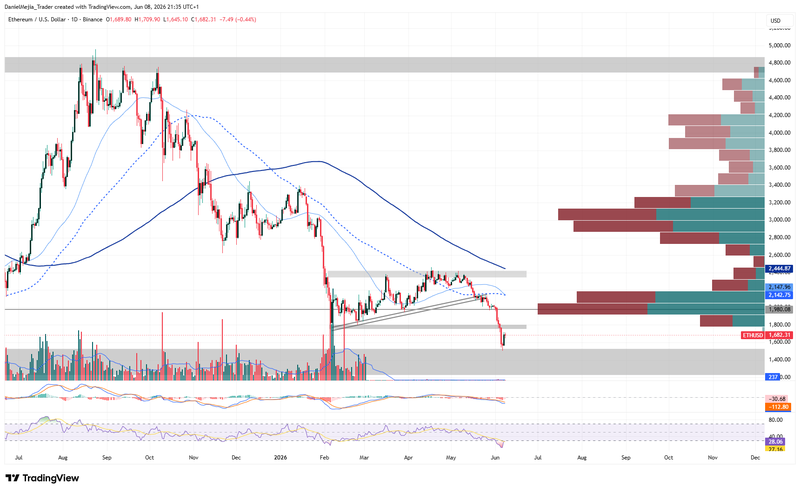
Figure 1. Ethereum Prices (2025–2026). Source: Data from the Binance Exchange; own analysis conducted via TradingView.


