Support
Ethereum surges following US midterm elections as oil prices plunge
Ethereum jumped 5.91% to $2,423 as plummeting oil prices and US midterm election results fuelled hopes of lower inflation.

Oil prices dropped by over 8%, easing inflation fears amid prospects of US–Iran diplomatic efforts.
Democratic control of Congress creates heightened scrutiny and uncertainty surrounding the proposed CLARITY Act.
Potential conflicts of interest regarding President Donald Trump's crypto ventures could receive increased attention from the US Congress.
Date: 5 November 2026 (GMT+3)
Why is Ethereum rising following the US midterm elections?
Ethereum prices jumped by 5.91% to $2,423 following the US midterm elections, which prompted a significant decline in oil prices.
Against this backdrop, Democrats secured majorities in both the Senate and the House of Representatives, generating optimism that inflationary pressures could subside alongside a potential diplomatic resolution between the US and Iran. With a majority in Congress, Democrats may attempt to restrict military funding, thereby complicating any continuation of the conflict.
At market close, the Brent crude futures contract (BRN) dropped by 8.67% to $94.62 per barrel, whilst West Texas Intermediate (WTI) fell by 8.29% to $88.12 per barrel.
However, the Democratic victory carries significant implications for digital assets. Notably, while existing crypto asset legislation is likely to remain in place, key questions linger over unpassed legislation such as the CLARITY Act—a regulatory framework aimed at establishing clearer federal rules for cryptocurrency trading.
In this context, a Democratic-controlled Congress could complicate efforts to pass the bill as lawmakers push for stronger investor protections. Furthermore, Democrats have raised concerns regarding potential conflicts of interest surrounding US President Donald Trump and his commercial crypto ventures, as highlighted in a CNBC report. Consequently, the CLARITY Act and related regulatory frameworks may face extended analysis and delays due to deeper legislative scrutiny.
Technical analysis of Ethereum
From a technical perspective, Ethereum is exhibiting bullish momentum. A detailed assessment of the current market structure reveals several key observations:
- Trend Context: Ethereum maintains an underlying bullish structure, trading above its 100-day and 200-day Simple Moving Averages (SMAs). Crucially, the price rebounded from a convergence zone between the 200-day SMA and the 50% Fibonacci retracement level, keeping the ascending trend intact.
- Momentum Indicators: Both the Moving Average Convergence Divergence (MACD) and the Relative Strength Index (RSI) signal upward trajectories from lower levels, suggesting that bullish momentum could strengthen in the short term. The RSI is recovering after trading in oversold territory, whilst the MACD reflects a bullish crossover. Together, both indicators demonstrate technical confluence pointing towards a probable near-term price recovery.
- Resistance Levels: Should the bullish momentum gain traction, the immediate technical ceiling sits at $2,750, followed by secondary resistance at $3,000—a prominent psychological barrier that coincides with a High Volume Node (HVN).
- Support Levels: Should selling pressure intensify, the next key technical floor is located at $2,150, where the 200-day SMA aligns with the 50% Fibonacci retracement level. A downside breach of this level would bring the next key support at $1,980 into focus, corresponding to the Volume Profile's Point of Control.
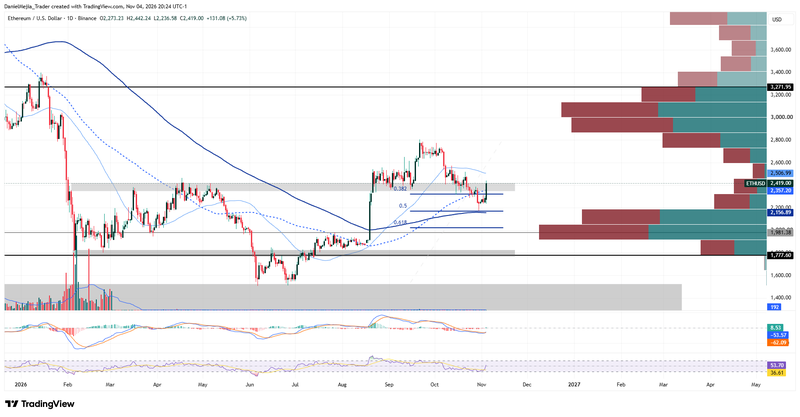
Figure 1. Ethereum Price (2025–2026). Source: Data from Binance Exchange; author’s analysis conducted via TradingView.