Support
 Ethereum’s technical analysis: A general overview
Ethereum has faced persistent selling pressure stemming from geopolitical risks and lingering expectations of a restrictive Federal Reserve policy, culminating in a 60% drawdown from its record high. However, a recent 22% rebound signals the potential for a short-term market recovery.

Geopolitical instability and capital rotation into artificial intelligence equities have driven a 60% drawdown to $1,909, prior to the recent 22% rebound.
Ethereum prices exhibit the potential for a directional expansion (whether bullish or bearish), as the EVIV index trades at suppressed levels historically associated with a possible volatility period.
While short-term momentum oscillators support the prospect of a bullish recovery, broader economic or geopolitical instability could continue to weigh heavily on price action.
Date: 20 July 2026
Ethereum under selling pressure, but signalling short-term recovery
Ethereum has come under selling pressure driven by escalating geopolitical tensions in the Middle East and growing market expectations that the Federal Reserve could adopt a more restrictive monetary policy stance. Within this macroeconomic environment, market participants have increasingly migrated toward defensive safe-haven assets. Concurrently, high-risk alternatives—most notably artificial intelligence equities—have attracted speculative capital away from the digital asset ecosystem. Since reaching its record high of $4,830, Ethereum’s price has declined to $1,909, representing an approximate drawdown of 60%.
However, over the course of the current month, price action has recovered by approximately 22%. This short-term rebound suggests that certain institutional investors and traders view current valuation levels as an attractive entry point. This recovery was initiated at the $1,500 inflection point, a major long-term structural support level that was firmly defended and rejected to the upside.
In this context, the Volmex Ethereum Implied Volatility Index (EVIV) is currently trading near a medium-term support zone around 52 points. The EVIV index measures the 30-day expected volatility of Ethereum by evaluating linked options pricing. Historically, the index tends to consolidate at lower levels prior to substantial directional price movements, whether bullish or bearish. At the current level of 52 points, Ethereum’s price recovery could gain further momentum if the market discount hypothesis takes hold. Conversely, intensified selling pressure could resume if ongoing geopolitical tensions escalate, reigniting inflationary concerns and reinforcing expectations of further monetary tightening by the Federal Reserve.
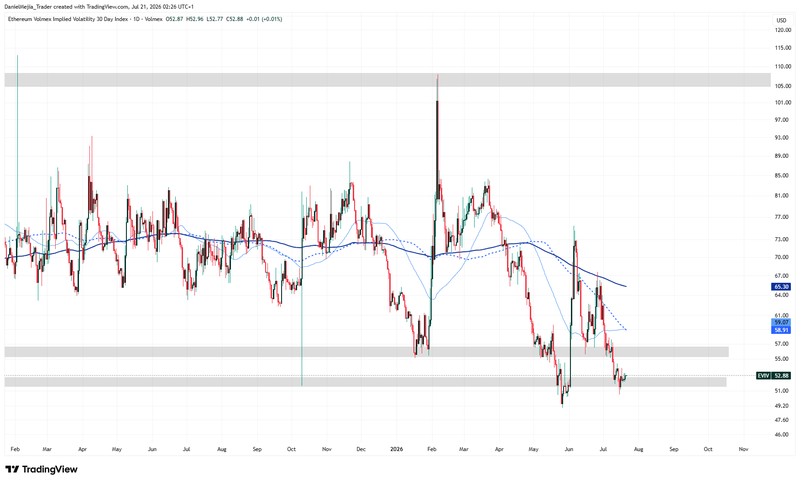
Figure 1. Ethereum Volmex Implied Volatility EVIV (2025-2026). Source: Own analysis conducted via TradingView.
Technical analysis of Ethereum
From a technical perspective, Ethereum maintains a well-defined downward trajectory across extended timeframes. A detailed assessment of the current market structure reveals several key observations:
- Trend Context: Ethereum continues to exhibit a broader downward bias, with the spot price trading beneath its 100-day and 200-day Simple Moving Averages (SMAs). This alignment reinforces the multi-month structure of lower highs and lower lows. However, while the overarching trend remains within this bearish regime, short-term momentum oscillators are beginning to develop an upward profile.
- Resistance Levels: Should immediate psychological resistance near the $2,000 threshold be decisively breached to the upside, the primary technical ceiling is identified at $2,180—a level that converges with the descending SMA. Reclaiming this structural pivot point would be an essential prerequisite for market bulls to re-establish sustained upward momentum.
- Support Levels: If short-term support at $1,800 is invalidated, the next critical floor lies at the $1,500 mark, representing a highly significant psychological boundary. A sustained close below this threshold would likely intensify liquidation pressure and significantly increase the probability of a deeper, more prolonged market correction.
- Momentum Indicators: Both the Moving Average Convergence Divergence (MACD) and the Relative Strength Index (RSI) display upward trajectories, suggesting that underlying bullish momentum is re-emerging. Notably, the MACD line has crossed above the zero signal threshold. Nevertheless, near-term price discovery will remain heavily dependent on the trajectory of the macroeconomic and geopolitical background.
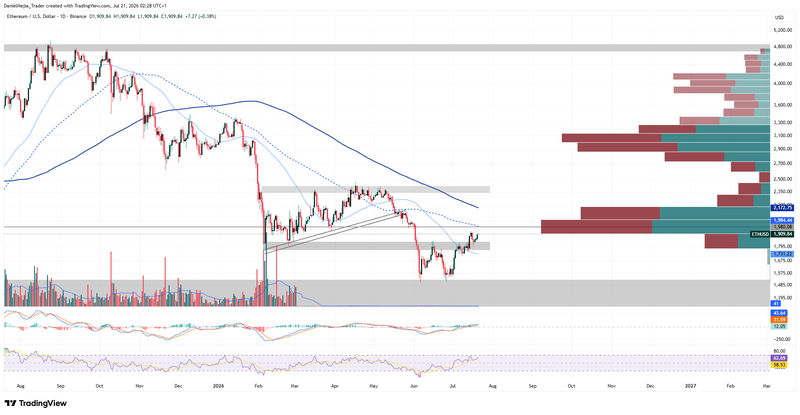
Figure 2. Ethereum’s Price (2025–2026). Source: Data from the Binance Exchange; own analysis conducted via TradingView.