Support
Ethereum tests key support level amid rising global inflation concerns
Ethereum is facing persistent selling pressure, testing key support near $2,350 as rising global inflation, surging energy costs, and anticipated Federal Reserve interest rate hikes weigh heavily on market sentiment.

Ethereum tests critical $2,350 support following two weeks of persistent sell-offs and downward momentum.
Global central banks tighten monetary policy as rising energy prices exacerbate ongoing inflationary fears.
Brent crude approaches $110 per barrel amidst escalating Middle East geopolitical tensions that threaten global oil supplies.
Date: 20 October 2026
Can Ethereum hold key support amid growing global inflationary pressures?
Ethereum prices are testing a critical support level near $2,350 following two weeks of pronounced selling pressure. This challenging macroeconomic backdrop is being driven primarily by rising inflationary pressures that have prompted global central banks to adopt potential restrictive monetary policy stances. In particular, the Federal Reserve has exerted considerable downward pressure on cryptocurrency markets, as market-implied probabilities signal further potential interest rate hikes in forthcoming policy decisions.
According to the CME FedWatch Tool, market-implied probabilities indicate a 77% likelihood that the Federal Reserve will raise its benchmark interest rate by 25 basis points at its December meeting, following an interest rate increase at its preceding policy decision.
Against this backdrop, rising energy costs have reinforced inflationary pressures as geopolitical conflict in the Middle East continues to intensify. At market close, the Brent crude futures contract (BRN) settled near $109.50 per barrel, having briefly breached the $110 threshold during the trading session. Escalating tensions involving the United States, Iran, the Houthi movement, and Saudi Arabia sustain fears among market participants that energy supply disruptions could worsen, thereby applying further upward pressure to global inflation rates.
Cryptocurrencies tend to be adversely affected in scenarios of elevated US interest rates, as global investors reallocate capital towards Treasury yields in search of higher risk-adjusted returns.
Technical analysis of Ethereum
From a technical perspective, Ethereum is undergoing a price retracement following a sustained bullish impulse over recent months. A detailed assessment of the current market structure reveals several key observations:
- Trend Context: Ethereum maintains an underlying bullish structure, trading above its 100-day and 200-day Simple Moving Averages (SMAs). However, over recent two weeks, the asset has experienced significant selling pressure that has driven prices towards critical technical support near $2,350.
- Momentum Indicators: Both the Moving Average Convergence Divergence (MACD) and the Relative Strength Index (RSI) are tracking downward trajectories, suggesting that short-term bearish retracement may persist. Nevertheless, the MACD histogram is displaying an inflection point, indicating that selling momentum could be waning.
- Resistance Levels: Should the $2,350 support level hold, a potential rebound could bring the $2,750 region into focus as a primary short-term resistance zone. A decisive break above this level could signal renewed bullish momentum, with the $3,000 psychological threshold acting as a secondary resistance level.
- Support Levels: Should short-term selling pressure persist below the $2,350 support level, the $2,170 area serves as a key support zone, where the 50% Fibonacci retracement level of the prior bullish move converges with the 200-day SMA. Below this, the $2,000 psychological mark represents further significant support, aligning with the 61.8% Fibonacci retracement level and the Volume Profile's Point of Control (POC).
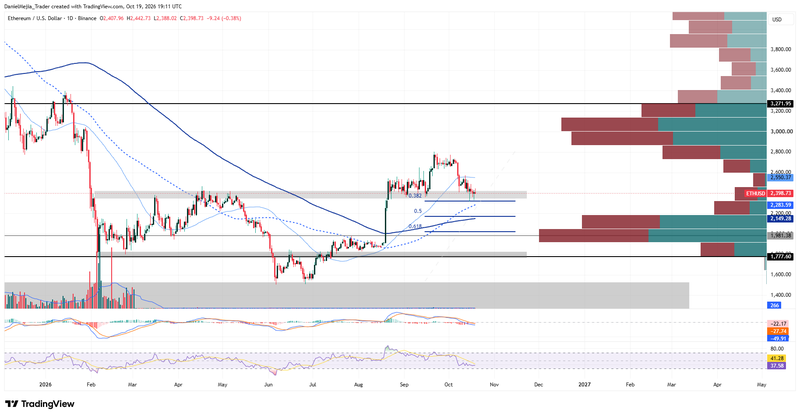
Figure 1. Ethereum Price (2025–2026). Source: Data from Binance Exchange; author’s analysis conducted via TradingView.