
 Support
 Solana rallies as falling Fed rate hike expectations boost risk appetite
Declining Federal Reserve rate hike expectations have boosted risk appetite, driving a 4.58% cryptocurrency market rally. Solana advanced to $104, although momentum indicators signal caution regarding the current bullish impulse.

Federal Reserve rate hike probability fell to 50.5% following dovish remarks from Fed Governor Waller and US Vice President JD Vance.
Lower rate expectations fuelled a 4.58% surge in total cryptocurrency market capitalisation as risk appetite rose.
Solana's price advanced by 3.56%, reaching the $104 level.
Date: 3 September 2026
Why are Federal Reserve rate hike expectations declining, and what does it mean for the crypto market?
The cryptocurrency market surged amid diminishing expectations that the Federal Reserve will raise interest rates at its upcoming September meeting. Total market capitalisation advanced by 4.58% by market close, demonstrating robust bullish sentiment. A lower interest rate environment in the United States typically heightens risk appetite, as US government bonds become comparatively less attractive. In this context, investors frequently anticipate these policy shifts, driving broad asset strength.
According to the CME FedWatch Tool, the market-implied probability of a rate increase ahead of the central bank's monetary policy decision dropped to 50.5%, down significantly from recent sessions when the likelihood hovered near 60%. Conversely, the probability of target rates remaining unchanged rose to 49.5%. The Federal Reserve is scheduled to deliver its policy decision on 16 September, with market participants closely monitoring forthcoming employment and inflation reports from the Bureau of Labor Statistics.
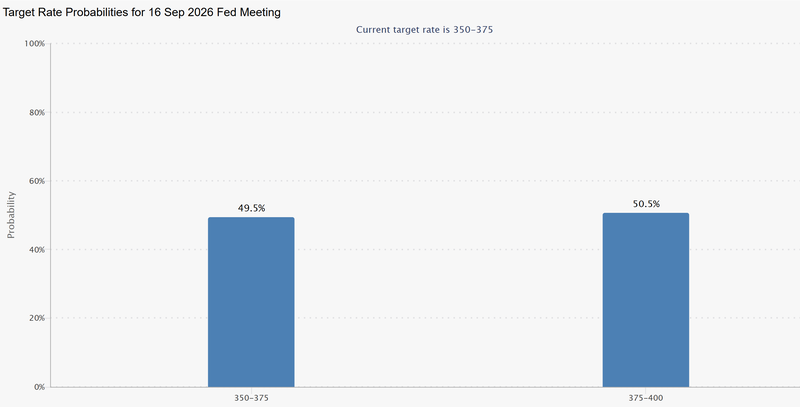
Figure 1. Target Rate Probabilities for 16 Sep 2026 Fed Meeting (3 September 2026). Source: Figure obtained from the CME Group.
This shift in sentiment followed dovish remarks from key US policy figures. According to Reuters, Federal Reserve Governor Christopher Waller stated that he would support maintaining interest rates at current levels provided inflation continues to decelerate. Furthermore, US Vice President JD Vance noted that the Federal Reserve should cut interest rates to enhance housing affordability, as reported by CNBC. He added that "it would be nice to have some help from the Fed" amidst a complex US government debt environment.
Following these comments, Solana's price rose by 3.56% to reach $104. This price appreciation followed the successful defence of a key support level, reinforcing a structural breakout above resistance at $97.50. However, momentum indicators signal caution regarding the immediate bullish impulse, as technical metrics are currently trading in overbought territory.
Technical analysis of Solana
From a technical perspective, while Solana previously established a distinct bearish trajectory, the asset is currently signalling a meaningful price recovery. A detailed examination of the current market structure reveals the following key dynamics:
- Trend Context: On daily timeframes, Solana has reclaimed its 50-day, 100-day, and 200-day Simple Moving Averages (SMAs) and is trading comfortably above these key benchmarks. In the short term, the price is signalling a potential retest or pullback near a key pivot zone, which could facilitate further appreciation if bullish momentum persists.
- Resistance Levels: Should price action breach short-term resistance at $110, the next major technical barrier lies at $132—a level that converges with the Volume Profile's Value Area High (VAH). A decisive close above these levels would increase the probability of expansion towards higher market capitalisation levels.
- Support Levels: If structural support at $97.50 is breached to the downside, the primary structural floor sits at $83, a technical zone that aligns with the 200-day SMA. A sustained breakdown below this threshold would likely accelerate selling pressure and heighten the risk of a deeper market correction.
- Momentum Indicators: The Moving Average Convergence Divergence (MACD) exhibits a bearish crossover, pointing towards potential price consolidation or a short-term retracement. Meanwhile, the Relative Strength Index (RSI) is trading in overbought territory, suggesting caution regarding the sustainability of the immediate bullish impulse.
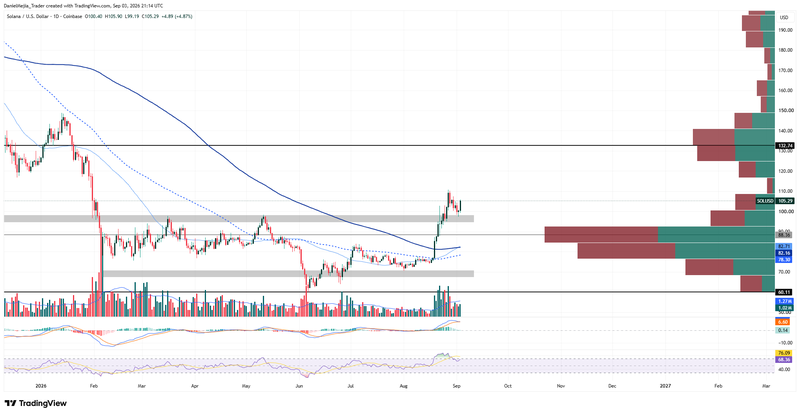
Figure 2. Solana’s Price (2025–2026). Source: Data from the Coinbase Exchange; author's analysis conducted via TradingView.


