
 Support
 UK sanctions on Russian crypto ecosystem deepen market uncertainty
The United Kingdom has imposed sanctions on Russia-linked cryptocurrency platforms to restrict their payment processing capabilities. This regulatory crackdown, compounded by escalating US–Iran tensions near the critical Strait of Hormuz, has driven investors away from high-risk digital assets.
The UK government has frozen the assets of several Russia-linked crypto platforms to curb sanctions evasion, provoking a sharp diplomatic rebuke from Moscow.
US Military actions near the strategic Strait of Hormuz have intensified global macroeconomic and geopolitical risk, prompting an investor pivot toward more defensive assets.
Categorised as a risk-on asset amidst the broader macroeconomic turmoil, Ethereum dropped 1.82% to trade at $2,073, breaching critical short-term support and reflecting a broader capital flight from the cryptocurrency market.
United Kingdom sanctions Russian crypto platforms; Ethereum drops on regulatory concerns
According to reports from Reuters, the United Kingdom has targeted multiple Russia-linked cryptocurrency platforms, asserting that these networks are being actively utilized to bypass international restrictions. Consequently, the British government has frozen associated domestic assets and introduced strict prohibitions preventing UK firms from processing payments or maintaining correspondent ties with the implicated entities. In response to these measures, the Russian Embassy in London issued a statement declaring the newly applied sanctions unlawful.
Beyond the heightened regulatory friction in UK–Russian relations, the cryptocurrency market is facing sustained downward pressure from wider geopolitical instability. Reports indicate that Iran has accused the United States of violating their bilateral ceasefire following US military strikes on Iranian territory, specifically targeting regions adjacent to the strategic Strait of Hormuz. In response, Washington maintained that its actions were defensive measures aimed at dismantling missile installations and vessels attempting to deploy naval mines. Simultaneously, ongoing hostilities in Lebanon between Israel and Hezbollah have added a secondary front to the region's friction, suggesting that the broader US–Israel–Iran conflict may persist and escalate.
Consequently, this highly volatile macroeconomic landscape has prompted market participants to de-risk their portfolios. Capital is noticeably rotating out of high-beta risk assets and flowing into traditional defensive vehicles, such as sovereign bonds and reserve fiat currencies. Under these conditions, Ethereum fell by 1.82% to $2,073, breaking beneath a critical short-term support area and signalling potential further weakness across the digital asset sector.
Technical analysis of Ethereum
From a technical standpoint, Ethereum is currently navigating a distinct consolidation pattern that denotes significant market uncertainty. A detailed breakdown of the current market structure reveals several key observations:
- Trend Context: Within a long-term framework, Ethereum continues to trade beneath its 200-day Simple Moving Average (SMA), a positioning that reinforces the prevailing bearish sentiment.
- Resistance Levels: Should immediate overhead resistance near $2,400 be breached to the upside, the primary technical ceiling is identified at $2,500, which converges with the declining 200-day SMA. Reclaiming this structural benchmark is considered a necessary prerequisite for re-establishing a sustained bullish trajectory.
- Support Levels: If the immediate psychological support at $2,000 is compromised, the next critical floor resides at the $1,800 mark—a vital structural support. A sustained close beneath this threshold would likely intensify selling pressure and heighten the probability of a more profound market correction.
- Momentum Indicators: The Moving Average Convergence Divergence (MACD) indicator is currently crossing below the zero line, suggesting that downward momentum could capture further territory. Conversely, the Relative Strength Index (RSI) is approaching the oversold threshold, indicating a need for near-term caution.
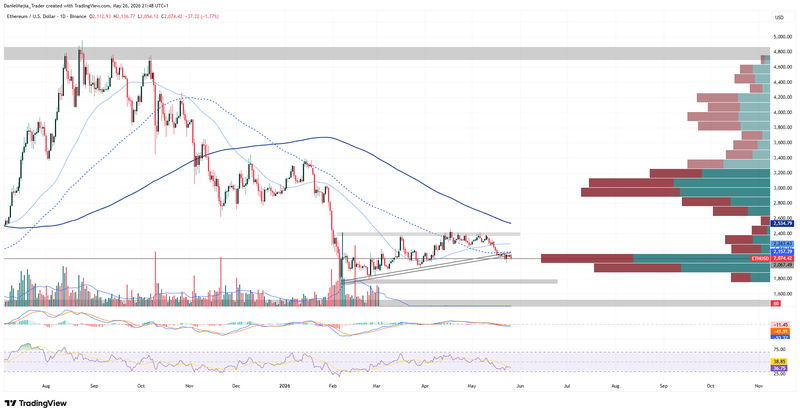
Figure 1. Ethereum Prices (2025–2026). Source: Data from the Binance Exchange; Own analysis conducted via TradingView.


