Support
Amazon shares trade volatile following Q3 2026 earnings report
Amazon’s shares experienced volatility post-Q3 2026 earnings as market participants weighed missed revenue and earnings per share (EPS) estimates alongside heavy artificial intelligence (AI) capital expenditure (CapEx) against record AWS growth and strong operating margins.

Amazon's Q3 revenue fell short of expectations at $201.94 billion and EPS dipped 3% year-on-year (YoY) to $1.89 amidst heavy CapEx spending.
AWS net sales surged 39.3% YoY, marking its fastest quarterly growth rate in nearly five years.
Operating margin reached a record high of 13.9%, driven by operating income of $28.1 billion.
Debt-to-assets rose to 23.70%, though debt-to-equity (49%) remains close to the industry average.
Date: 4 November 2026 (GMT+3)
Why are Amazon shares trading volatile following the Q3 2026 earnings report?
Amazon Inc. (AMZN) shares have exhibited volatile performance following the release of the company's Q3 earnings report. Immediately after the announcement on 29 October, the shares declined; however, over subsequent trading sessions, the price recovered and gained upward momentum. At market close, Amazon's shares advanced by 2.6%, reaching $250.69.
On the one hand, the internet retail giant fell short of market expectations in both total revenue and earnings per share (EPS). The company reported revenue of $201.94 billion, missing the market consensus forecast of $202.22 billion. In turn, the firm reported an EPS of $1.89, falling short of the $1.97 estimate. These results reflect a year-on-year (YoY) revenue increase of 12%, alongside a 3% annual decline in EPS.
Additionally, market participants subjected the negative cash flow reported by Amazon to intense scrutiny, driven by prominent capital expenditure (CapEx) that sharply exceeded operating cash flows. Amazon reported quarterly capital expenditure of $77.26 billion—a substantial figure that required external debt financing to cover investment requirements. Against this backdrop, free cash flow during the third quarter stood at negative $34.84 billion, marking a third consecutive quarter of negative readings.
On the other hand, Amazon's report highlighted significant growth in the AWS segment, where net sales increased by 39.3%—its fastest growth rate in nearly five years. Additionally, the firm reported an operating income of $28.1 billion, achieving an operating margin of 13.9%, the highest reading in the company's history. These results may be supporting a higher market capitalisation, as both metrics appear to justify elevated capital expenditure as returns from artificial intelligence initiatives begin to materialise.
Financial overview of Amazon Inc.
Amazon’s revenue trajectory has demonstrated solid expansion in recent years. Over the 2020–2026 period, the year-on-year (YoY) revenue growth rate averaged 26.38%; however, the latest quarter witnessed a notable deceleration in growth to the 12% level. Regarding net income performance, the latest reading signalled an annual decline of 2.3%, a point of concern that could be weighing on market confidence.
Meanwhile, asset growth maintains a prominent upward trajectory, though part of this expansion has required external debt financing. In this context, whilst the debt-to-assets ratio had been declining over the past six years to 20.77%, it has reached an inflection point over the last three quarters, rising to 23.70% in the latest reading. Remarkably, Investing.com reports that Amazon's debt-to-equity ratio stands at 49%, remaining below the 55% industry average, which suggests that leverage remains controlled despite the underlying increase in total debt.
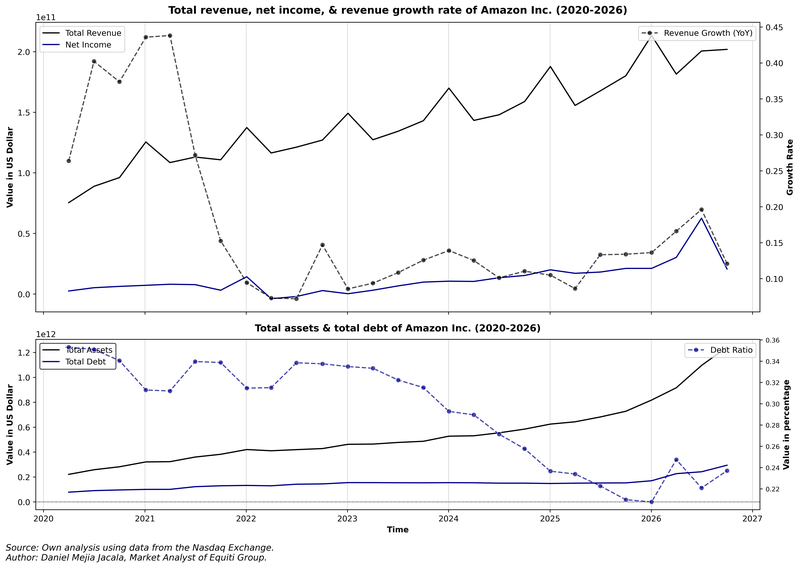
Figure 1. Amazon’s Revenue, Net Income, Total Debt, and Total Assets (2020–2026). Source: Author's analysis using data from the Nasdaq Exchange.
Lastly, regarding valuation metrics, Amazon exhibits figures close to industry benchmarks. Investing.com reports a price-to-earnings (P/E) ratio of 20.33x, holding close to the 20.28x industry average. In turn, the price-to-book (P/B) ratio stands at 4.23x, aligning closely with the 4.13x industry average.
Technical analysis of Amazon’s shares
From a technical perspective, despite recent volatility, Amazon’s share price maintains a long-term bullish trend. Key structural observations include:
- Trend Context: On long-term timeframes, Amazon preserves a market structure defined by a consistent sequence of "higher highs" and "higher lows". The price continues to trade above its 200-day Simple Moving Average (SMA), confirming underlying trend strength. Nevertheless, significant selling pressure has recently pushed the price below the 50-day and 100-day SMAs.
- Momentum Indicators: Both the Moving Average Convergence Divergence (MACD) and the Relative Strength Index (RSI) are currently situated at neutral levels, suggesting a temporary lack of directional bias.
- Resistance Levels: Should bullish momentum strengthen, the next critical resistance sits at the $263 technical ceiling. A decisive breakout and daily close above this level would increase the probability of an advance towards the next structural resistance at $277.
- Support Levels: If selling pressure regains momentum, the primary immediate support is $243—a level that converges with the 200-day SMA. Should this floor fail to hold, the next key support is $232, a market zone where the Volume Profile's Point of Control (POC) converges with an ascending trendline support.
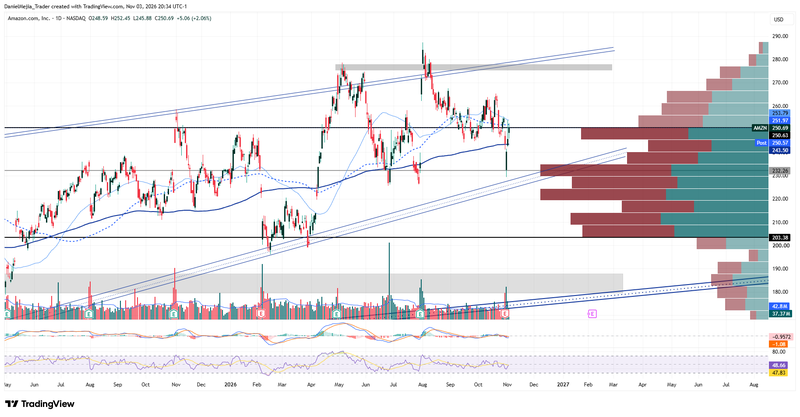
Figure 2. Amazon’s Share Price (2025–2026). Source: Data from the Nasdaq Exchange; Author's analysis conducted via TradingView.