
 Support
 AMD beats earnings expectations, but shares decline in after-hours trading
Advanced Micro Devices (AMD) surpassed quarterly revenue and earnings estimates, driven primarily by robust growth within its Data Centre segment. However, despite these strong fundamental results, the firm's shares fell by nearly 9% in after-hours trading as global investors subjected artificial intelligence (AI) valuations to intense scrutiny.
AMD’s revenue reached $11.54 billion (a 50.26% year-on-year increase) and non-GAAP earnings per share (EPS) hit $1.66, both outperforming Wall Street expectations.
Data Centre segment revenue surged 107% year-on-year to $6.7 billion, propelling total non-GAAP operating margin expansion to 27%.
Shares tumbled 9% post-market due to heightened investor scrutiny surrounding growth expectations in the broader technology and AI sectors.
The underlying technical setup retains its primary long-term bullish trend above key simple moving averages (SMAs), despite a bearish divergence on the MACD.
Date: 4 August 2026
AMD exceeds earnings forecasts, though investors send shares lower post-market
Advanced Micro Devices (AMD) exceeded Wall Street consensus estimates for both revenue and earnings per share (EPS) in its latest quarterly release. The semiconductor giant reported total revenue of $11.54 billion, topping market consensus forecasts of $11.25 billion. Non-GAAP EPS reached $1.66, surpassing expectations of $1.60. These figures represent a solid year-on-year (YoY) revenue growth rate of 50.26% alongside a substantial 245% annual increase in non-GAAP EPS.
However, despite AMD's strong quarterly results and financial performance, the company's shares fell by approximately 9% during the post-market session. This sell-off illustrates the rigorous scrutiny market participants are currently applying to US corporations—particularly those tied to technology and artificial intelligence (AI) themes.
Based on the latest official market close, AMD’s market capitalisation stands at $845.60 billion, placing it as the 14th most valuable company in the S&P 500 index. This valuation underscores the significant role AMD’s growth trajectory plays within the broader semiconductor industry.
Notably, AMD's earnings report highlighted an expansion in operational efficiency, with its non-GAAP operating margin rising to 27% compared to the 25% recorded in Q1 2026. Segmental performance revealed that Data Centre revenue reached $6.7 billion—a 107% YoY growth rate—while the combined Client and Gaming segments generated $3.8 billion (representing 6% growth YoY), and the Embedded segment contributed $977 million (a 19% YoY increase). These results demonstrate how the Data Centre division is increasingly becoming the central engine of the firm's revenue profile.
Technical analysis of AMD’s share price
From a technical perspective, AMD’s share price maintains its primary long-term bullish trajectory. Key structural observations include:
- Trend Context: Over the long term, AMD continues to exhibit a market structure defined by higher highs and higher lows. The share price remains positioned above its key long-term Simple Moving Averages (SMAs)—specifically across the 50, 100, and 200-day periods—reinforcing the prevailing bullish bias.
- Resistance Levels: Should current bullish momentum continue, the primary resistance level is identified at $580, marking the historical high. A decisive breach above this ceiling would indicate potential for further price discovery, with the $600 and $700 psychological thresholds serving as the most relevant subsequent technical levels.
- Support Levels: If immediate short-term support at $445 fails to hold, the next critical floor is situated at $300—a major structural barrier that aligns with the 200-day SMA. A failure to defend the $300 zone would significantly increase the probability of a broader trend correction.
- Momentum Indicators: Both the Moving Average Convergence Divergence (MACD) and the Relative Strength Index (RSI) are signalling downward trajectories, indicating that upside momentum may be waning. Crucially, the MACD is exhibiting a bearish divergence, pointing to the possibility of a short-term pullback or consolidation phase.
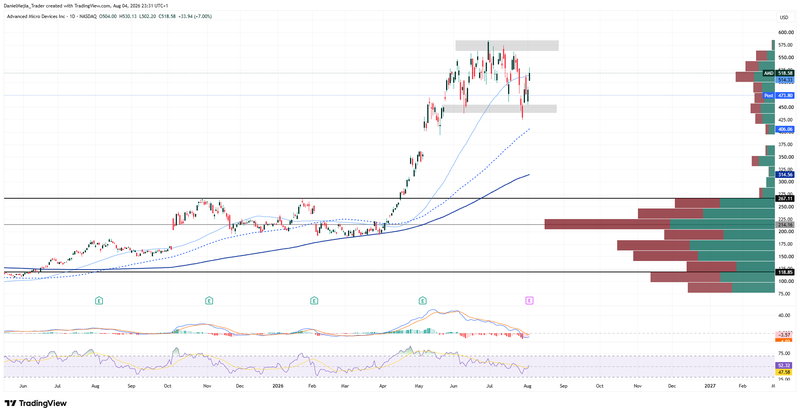
Figure 1. AMD Share Price (2025–2026). Source: Data from the Nasdaq Exchange; Own analysis conducted via TradingView.


